cNGN users on Base hit a high while its volume fell, for the second week running
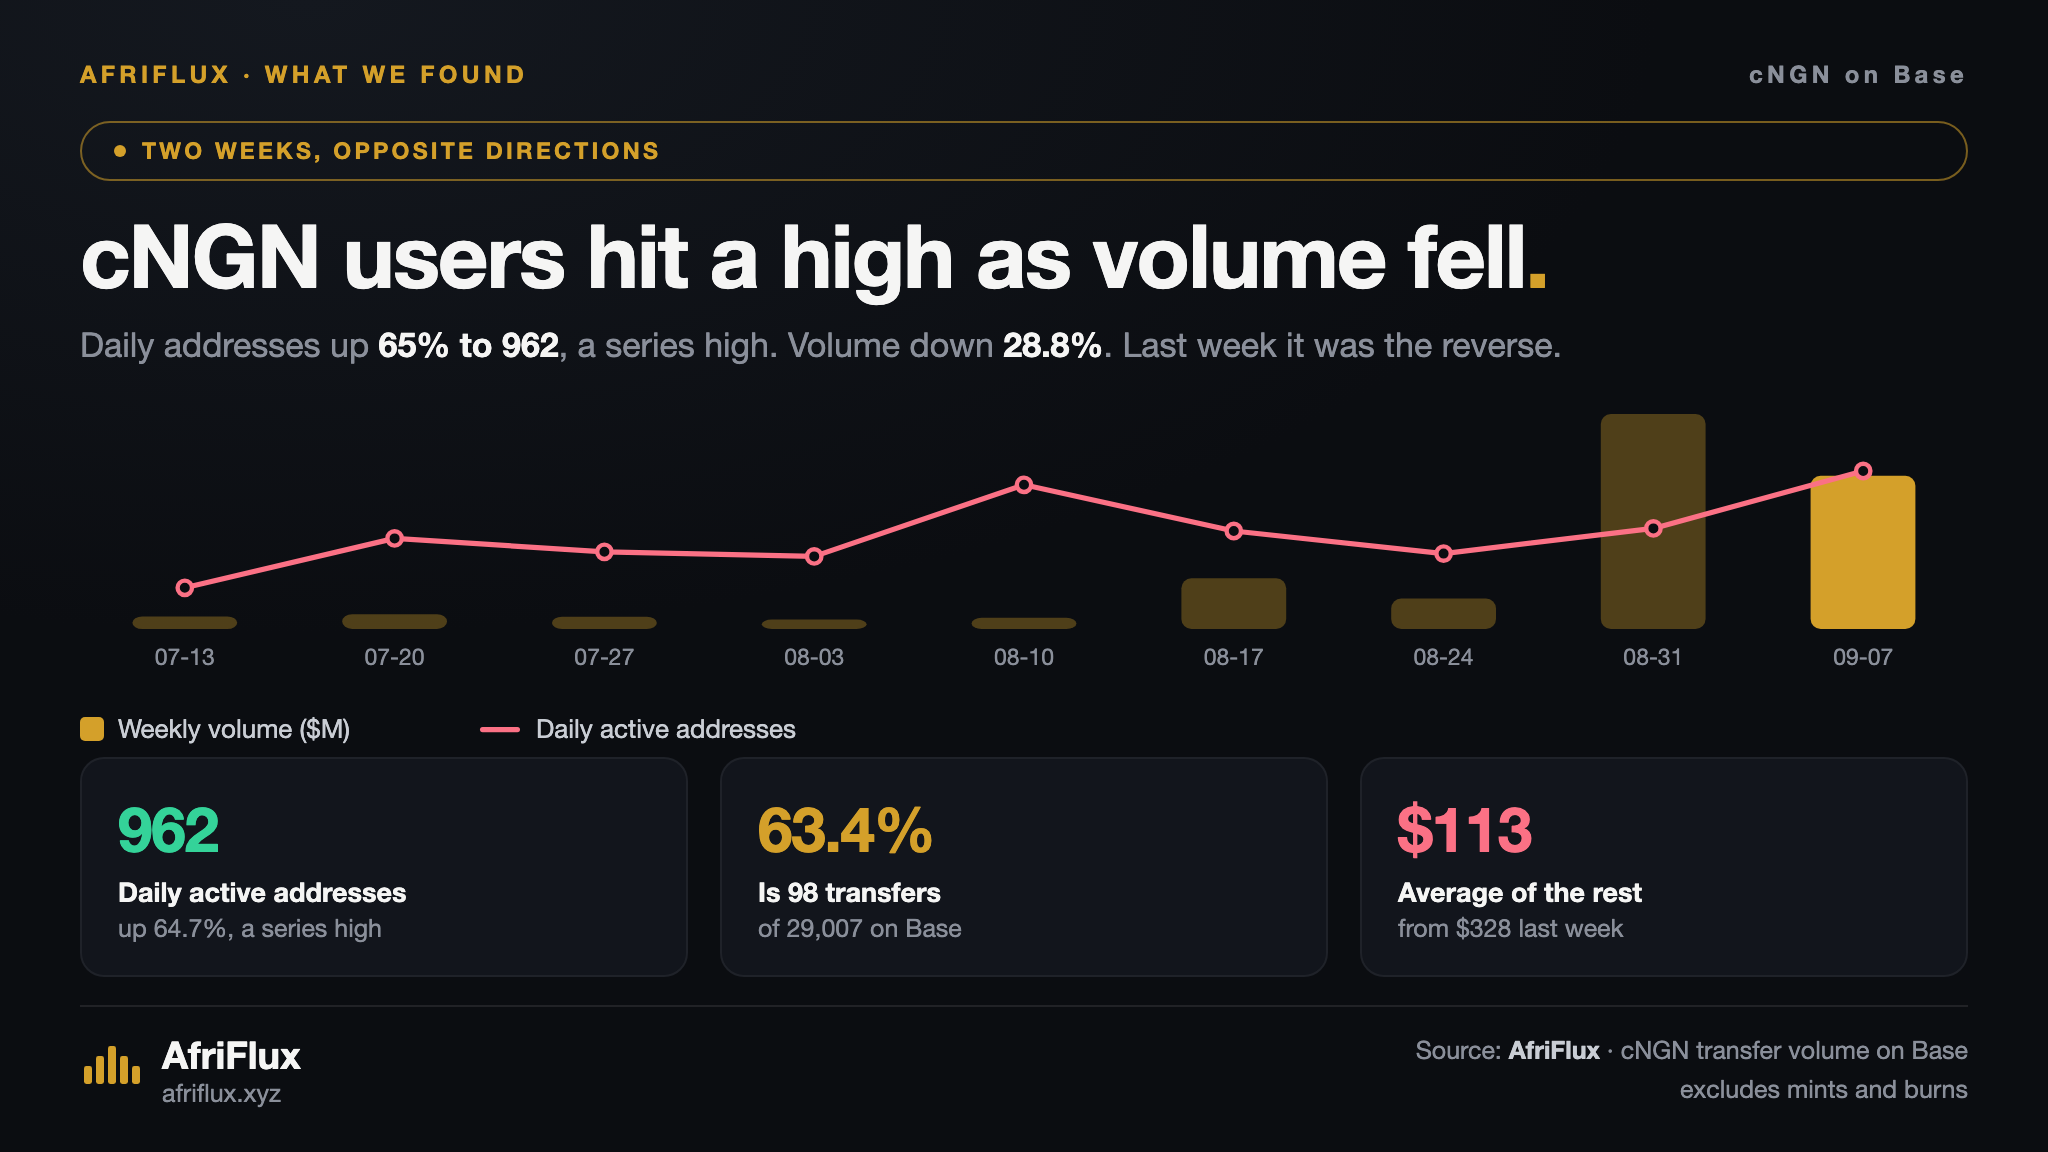
cNGN transfer volume on Base fell 28.8% while daily active addresses rose 65% to 962, the highest we have recorded. Last week the two also moved apart, in the other direction. Two opposite weeks make the case better than one: on Base, cNGN volume is not a usage measure, and even the part outside the treasury loop is falling as users rise.
- 962
- Daily active addresses
- −28.8%
- Base transfer volume
- 63.4%
- Carried by 98 transfers
- $113
- Average of everything else
up 64.7%, a series high
$12.49M to $8.90M
0.34% of 29,007
from $328 last week
Last week we argued that cNGN's record transfer volume on Base was not adoption: 70 transfers carried 56.7% of it, most of them one mint walked through a relay into HyperFX solver inventory. The week with the most users had done the least volume.
This week ran the other way, and it makes the same point more strongly.
| Week | Daily active addresses | Transfers | Volume |
|---|---|---|---|
| 10 Aug | 870 | 24,259 | $655,680 |
| 31 Aug | 584 | 16,535 | $12,490,118 |
| 7 Sep | 962 | 29,007 | $8,896,556 |
Daily active addresses rose 64.7% to 962 — the highest we have recorded. Transfers rose 75.4%. Senders rose 68.1%, to 884.
Volume fell 28.8%.
The claim
On Base, cNGN's transfer volume and its user base are moving independently, and the evidence is now two weeks in opposite directions rather than one.
A single week of high volume and low users can be an outlier. A following week of high users and falling volume cannot be explained by the same outlier. Across the last three rows of that table, the correlation between the two is effectively negative.
The concentration did not go away
98 transfers — 0.34% of the week's 29,007 — carried $5,639,957, or 63.4% of Base volume. That is a higher share than last week's 56.7%.
The largest of them are the same machinery: the mint signer sending to and receiving from two flagged business-partner addresses, $1.39M across six transfers; one deposit of $428,861 into the ycNGN vault; and the relay addresses we identified last week, still active.
The part we got too generous about
Last week we said the real growth underneath the headline was worth about $5.4M — the volume left once the concentrated transfers were removed.
This week that same residual is $3,256,599, down 39.7% — while the users behind it rose by two-thirds. The average transfer outside the concentrated set fell from $328 to $113.
So the non-treasury layer is not a clean usage measure either. More people are using cNGN on Base, and each of them is moving less. That is consistent with adoption by smaller users, and it is inconsistent with reading any cNGN volume figure — headline or residual — as a proxy for how many people use it.
What we would report instead
For cNGN on Base, the number that tracks usage is daily active addresses, and this week it is at a high. If someone tells you cNGN fell 25% this week, that is true. If they tell you cNGN usage fell, it is not.
Method
cNGN transfer volume, transfer counts, daily active addresses and senders on Base for the ISO weeks of 31 August and 7 September 2026, from the native stablecoin series. Transfer volume only — mints and burns are excluded. The concentrated portion is the sum of individually-ranked large transfer events for the week; the remainder is the residual against the full daily series, and is an approximation of non-treasury activity rather than a classified measure of it. Daily active addresses are averaged across the days in the week.
How attribution works →Cite this
Free to cite with attribution. No embargo, no approval needed.
AfriFlux (2026). cNGN users on Base hit a high while its volume fell, for the second week running. Published 14 September 2026. https://www.afriflux.xyz/feed/cngn-users-and-volume-diverge-again
Reproducing a chart? Use this line: Source: AfriFlux — on-chain intelligence for Africa's stablecoin economy. afriflux.xyz