Ask anyone in African crypto whether stablecoins matter and you'll get the same answer: obviously. They're how people step out of the naira's slide, how freelancers get paid, how traders hop between exchanges, how small importers settle with suppliers in Guangzhou. That argument is over. Stablecoins won.
Now ask a harder question. How much stablecoin value actually moved through Nigerian platforms last quarter? Which venue processed the most? Are people putting more through the exchanges, or through the apps that cash them straight out to naira?
Silence — or a confident guess dressed up as a number.
We've had the thesis for years. We've never had the measurement. This piece is our attempt at the measurement.
The numbers everyone quotes aren't measurements
Look at how the size of this market usually gets described. A funding announcement with a user count nobody can verify. A single continent-wide figure from an annual report that folds fifty-four countries into one line. A founder's tweet. A round number that gets repeated until it feels like a fact.
None of that answers a venue-level question, because none of it was built to. "Sub-Saharan Africa did $X billion" tells you nothing about whether Quidax or Busha moved more last quarter, whether the off-ramps are growing or shrinking, or where the users actually are. The conversation runs on vibes and press releases, and everyone knows it — they just haven't had an alternative.
"It's all onchain" — and that's the trap
The obvious rebuttal: it's public. Every transaction is right there on the blockchain, go read it.
True, and not the point. A blockchain is a ledger of addresses, not of businesses. It will happily show you that 0x6cfa… received nine hundred million dollars — it will not tell you that address is a Quidax hot wallet, or that the money behind it is one exchange's treasury bridge and not nine hundred million dollars of Nigerian retail demand. The transactions are public. The meaning is not.
That gap is the entire problem. Reading a chain is easy. Attribution — connecting an anonymous address back to the venue that controls it, and separating a real retail depositor from an internal plumbing wallet — is the hard, unglamorous work almost nobody does. It's where the actual signal lives, and it's what AfriFlux is built to do.
What AfriFlux does
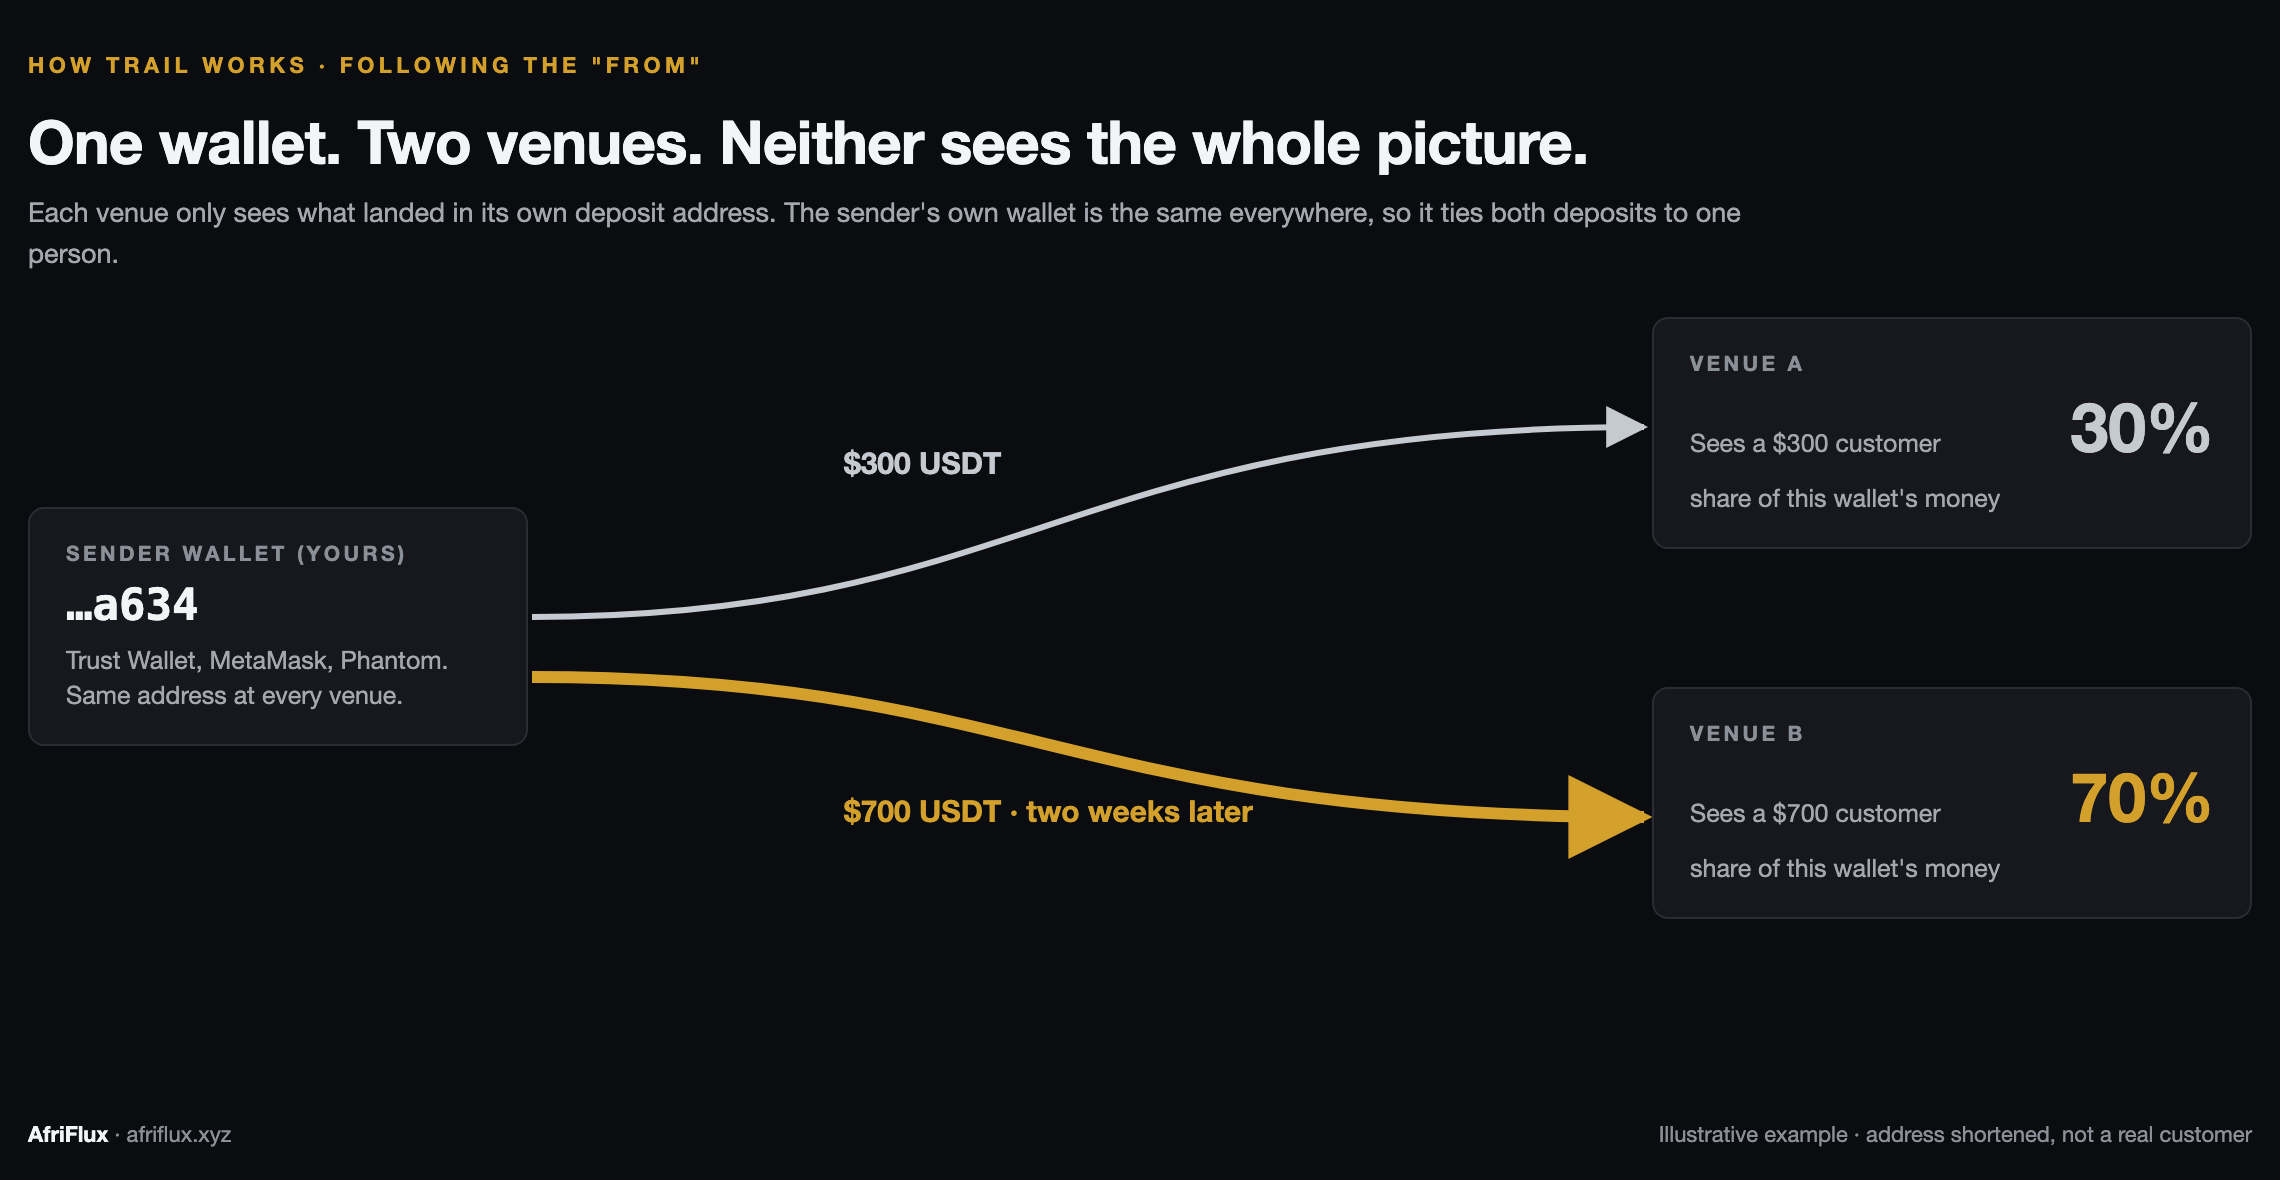
We map the operational skeleton of each venue from the chain up. Every venue funds and sweeps its users' deposits through a recognisable pattern — a gas funder here, a collection wallet there, a sweep path that repeats thousands of times. We anchor on those patterns to enumerate a venue's real deposit addresses, then confirm each one against the wallet that funds it and the wallet it sweeps into. Only after both sides check out does a wallet count as retail.
The result is a number you can stand behind: not "roughly this much flows through African crypto," but "this venue, this quarter, this many real depositors, this much volume." Every figure in this piece traces back to that process.
What we count as retail
Not every dollar touching a venue is a person. Treasury bridges, settlement rails out to Binance, market-maker flows and a handful of genuine whales all move through the same deposit addresses — and all of it inflates a naive "total volume." Our classification engine sorts deposit activity by size and behaviour, and only genuine retail flow reaches the headline numbers.
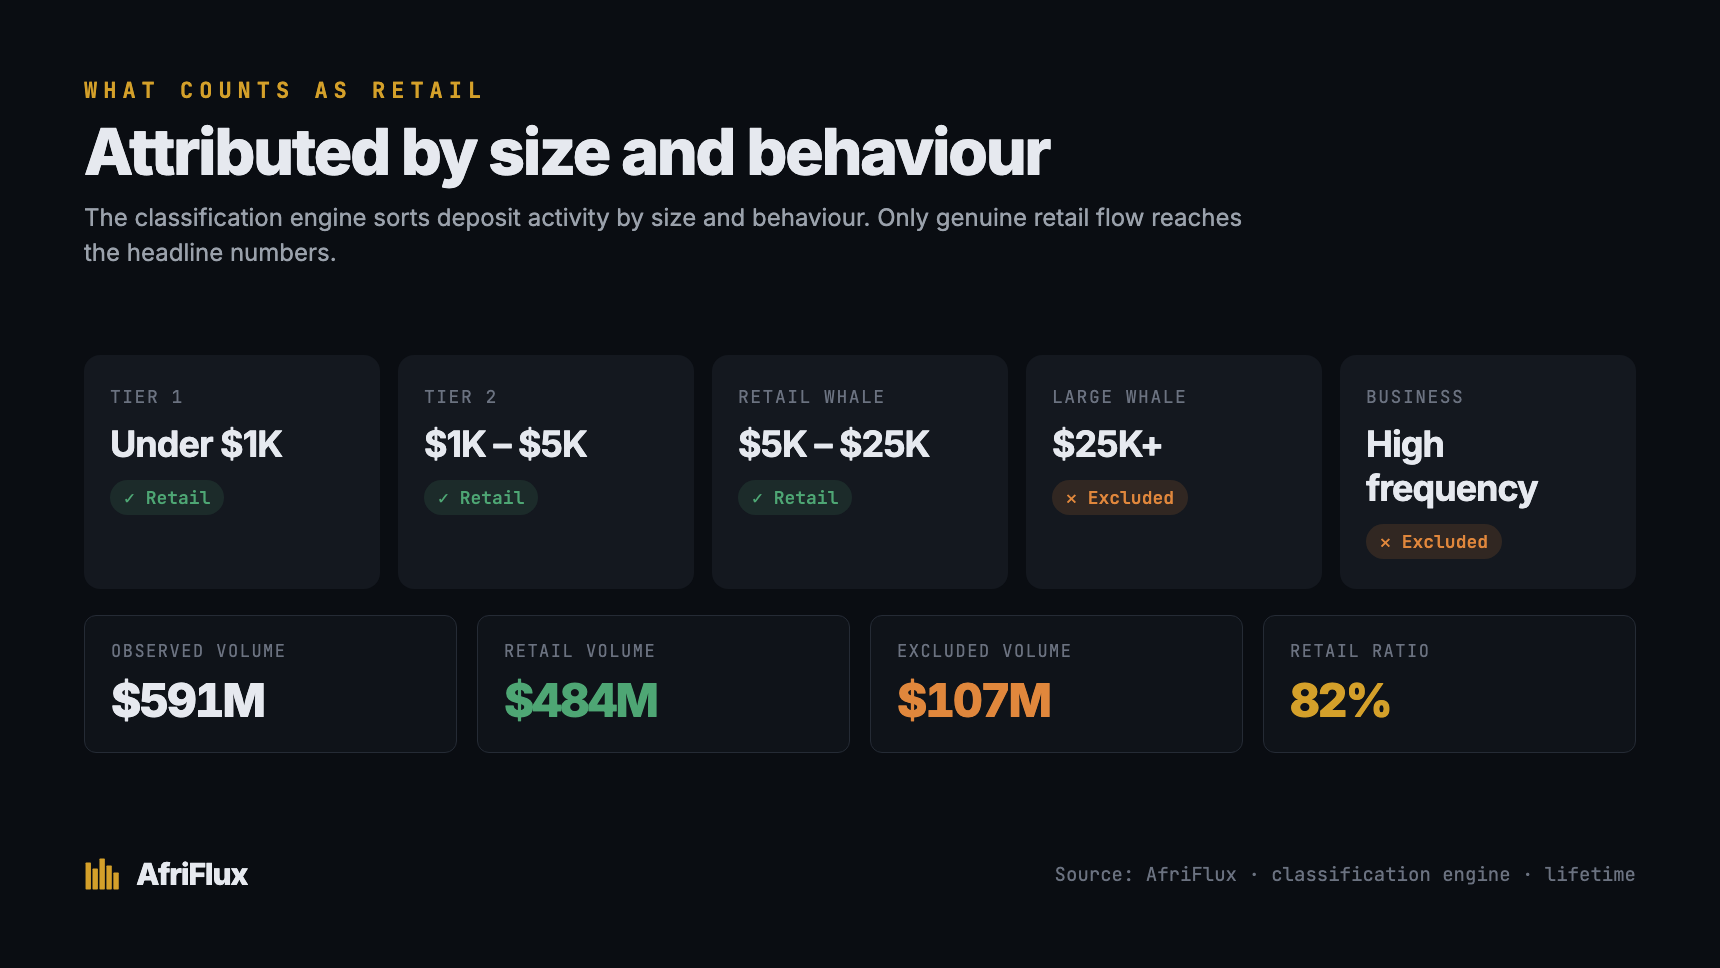
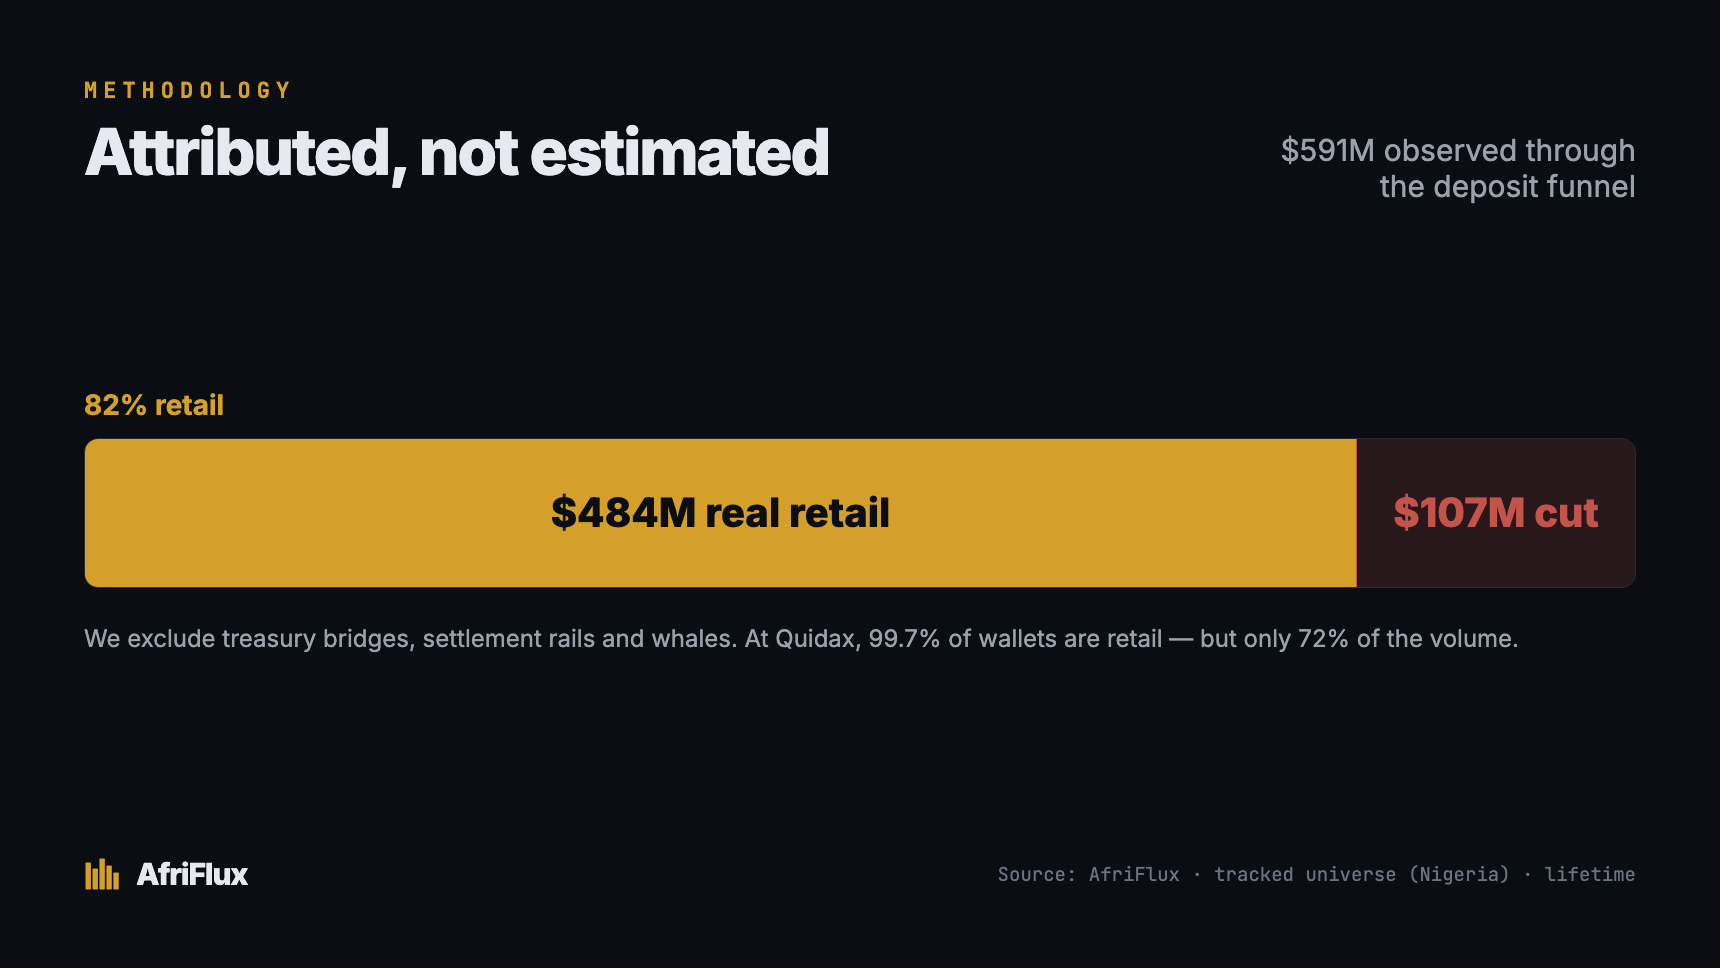
Across the ten venues, we observed $591M of deposit-funnel volume and classified $484M of it as retail — excluding roughly $107M of whale and institutional flow. Nearly all of that exclusion is a single venue: at Quidax, 99.7% of deposit wallets are real users, but they account for just 72% of its volume — a small number of whales move the rest, and we cut them. That gap is the entire difference between a transfer count and a measurement. See the full classification →
One honest boundary, stated up front. Onchain data cannot tell you a wallet-holder's nationality — addresses don't carry passports. So country here is a venue-level attribution: we assign a venue's flow to its home market. These ten venues are Nigeria-first operations, which is why we call this Nigeria's market. But several of them don't stop at the border — Chipper Cash operates across seven countries; Quidax and Roqqu run in Ghana, Kenya and beyond. A slice of what follows is therefore non-Nigerian, and as country coverage matures we'll split it out properly. We'd rather tell you where the claim's edges are than pretend they don't exist.
What's covered, and what isn't
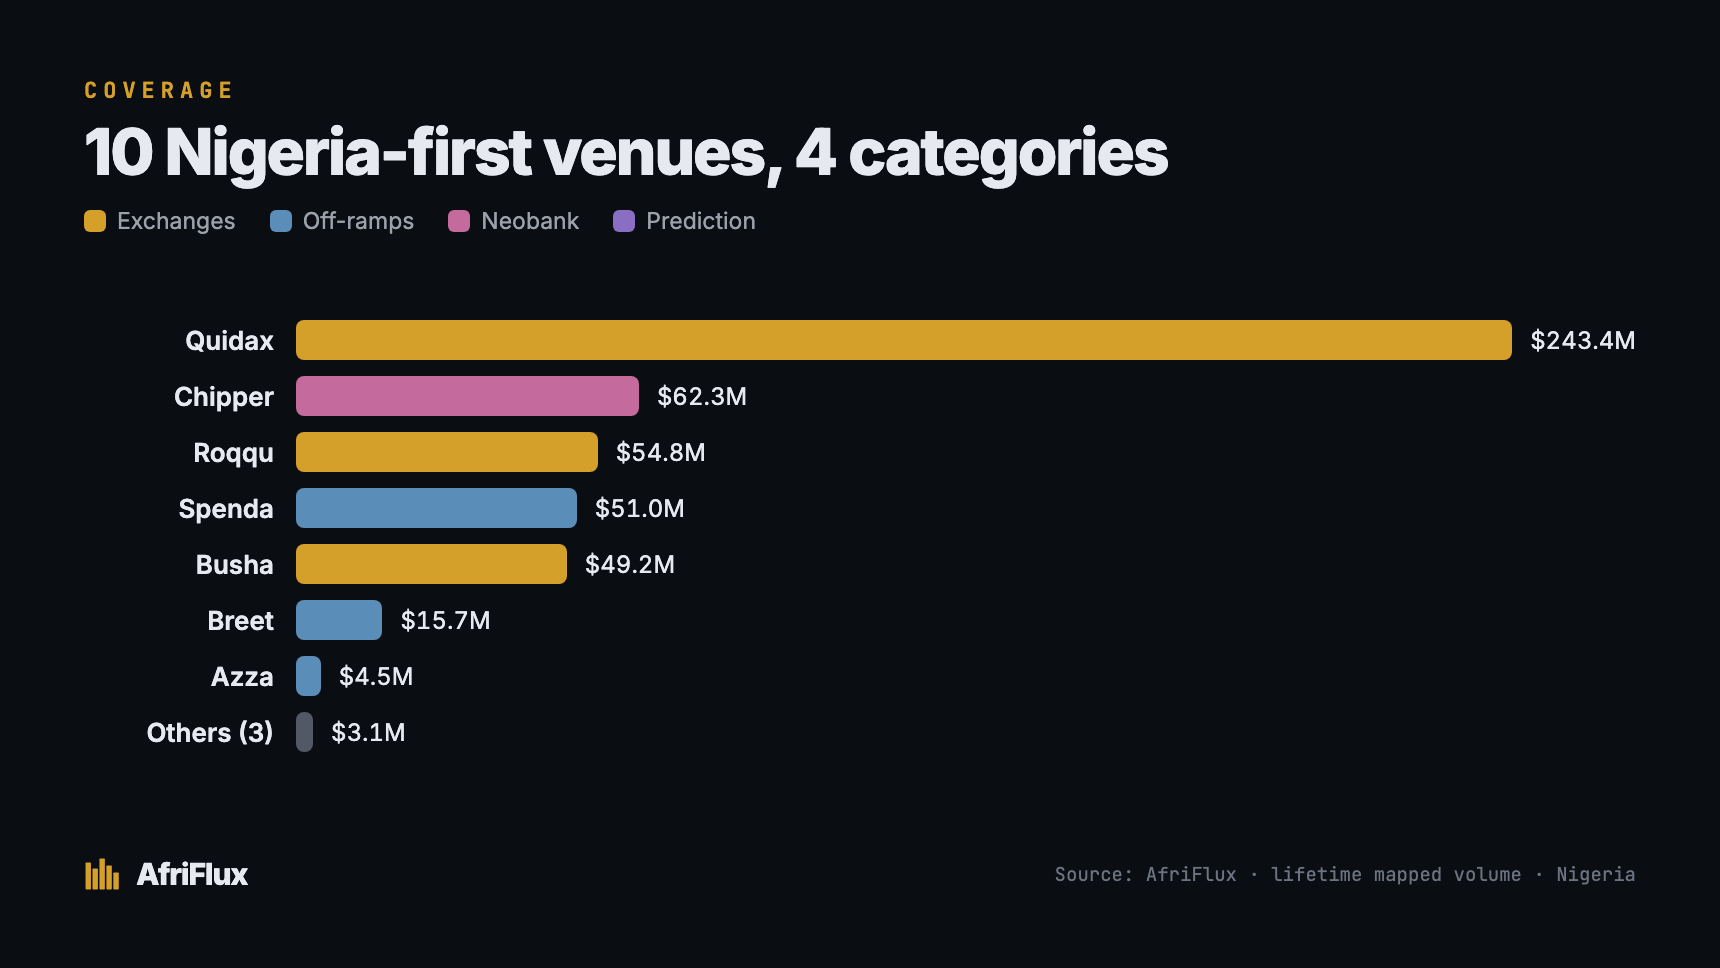
The launch tracks ten venues across four categories, all Nigeria-first:
- Exchanges — Quidax, Busha, Roqqu
- Off-ramps — Spenda, Breet, Azza, Noblocks, Paj Cash
- Neobank — Chipper Cash
- Prediction markets — Bayse
This is a tracked universe, not the whole ecosystem — and it says so on the dashboard, deliberately. There are venues we haven't mapped yet and chains we're still validating. Coverage grows as each new venue clears the same verification bar; nothing gets counted until it does. What you're seeing is the floor of this market, not the ceiling.
What the data actually shows
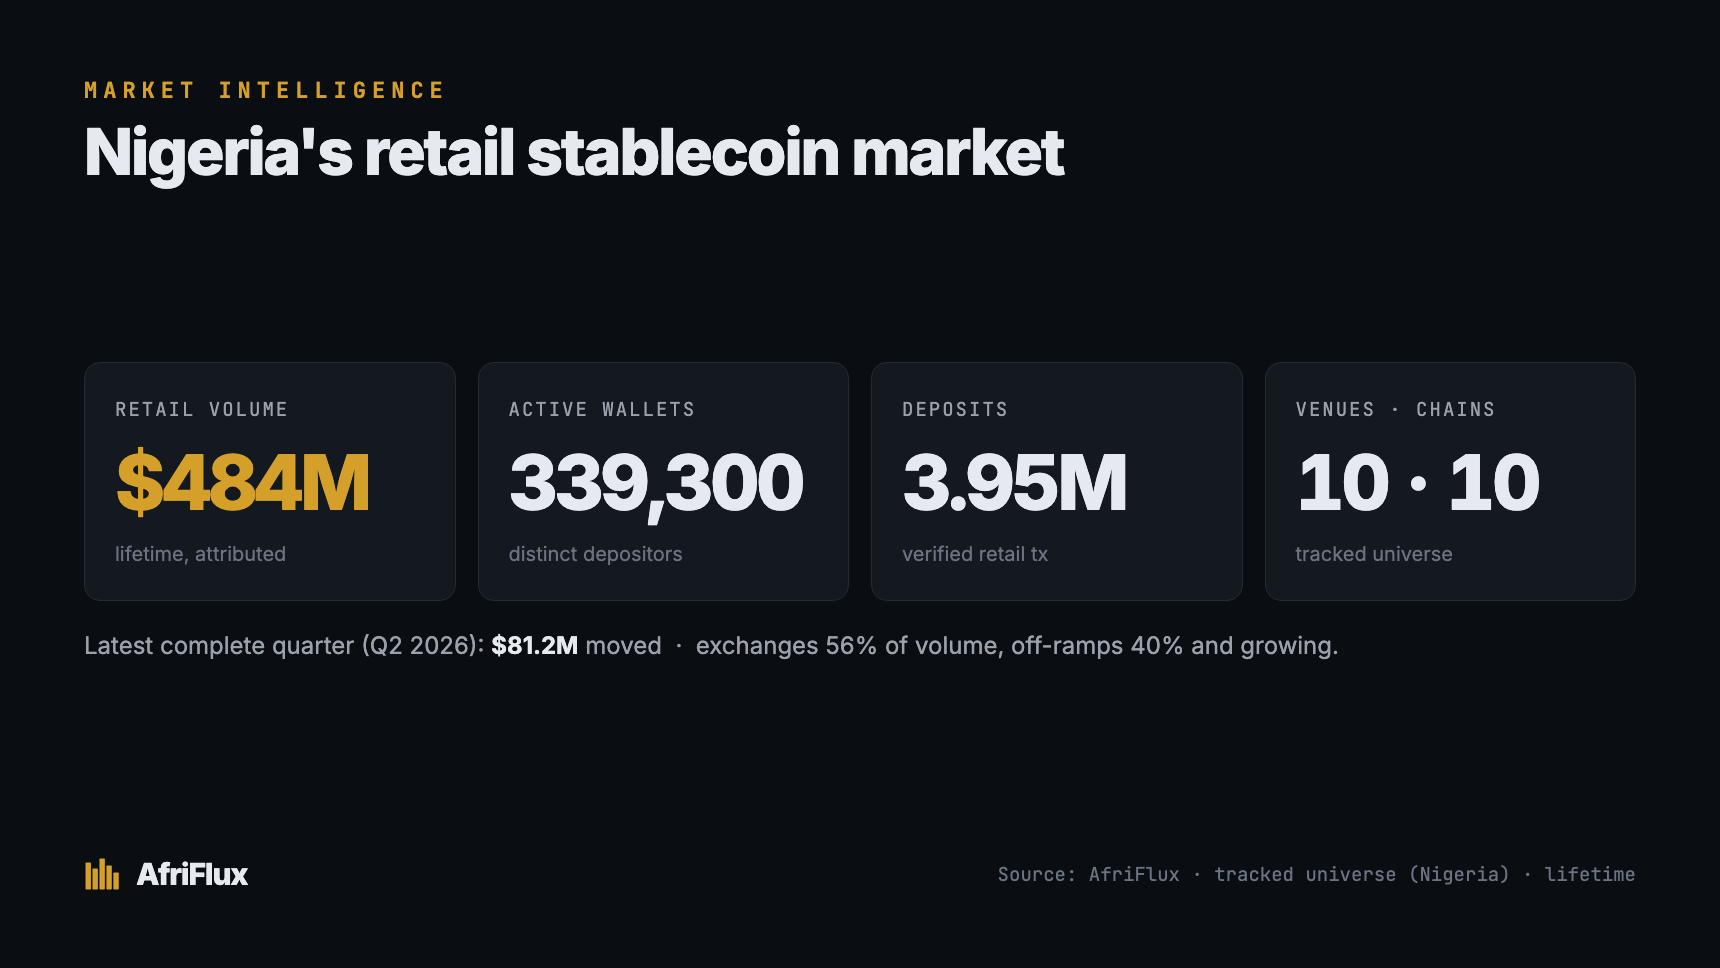
Since we began measuring, these venues have moved $484M in retail stablecoin value across 339,000 wallets and nearly four million deposits. As far as we can tell, that's the first ground-truth measurement of Nigeria's retail stablecoin market that exists anywhere — not a survey, not an extrapolation, but attributed onchain flow. In the most recent complete quarter alone, $81M moved. Four things stand out.
Quidax still anchors the market — 42% of last quarter's volume, more than the next three venues combined. That's the number most people would expect, and it's real. It's also the least interesting line in the dataset, because the moment you look past the leaderboard, this market stops behaving the way the headlines assume.
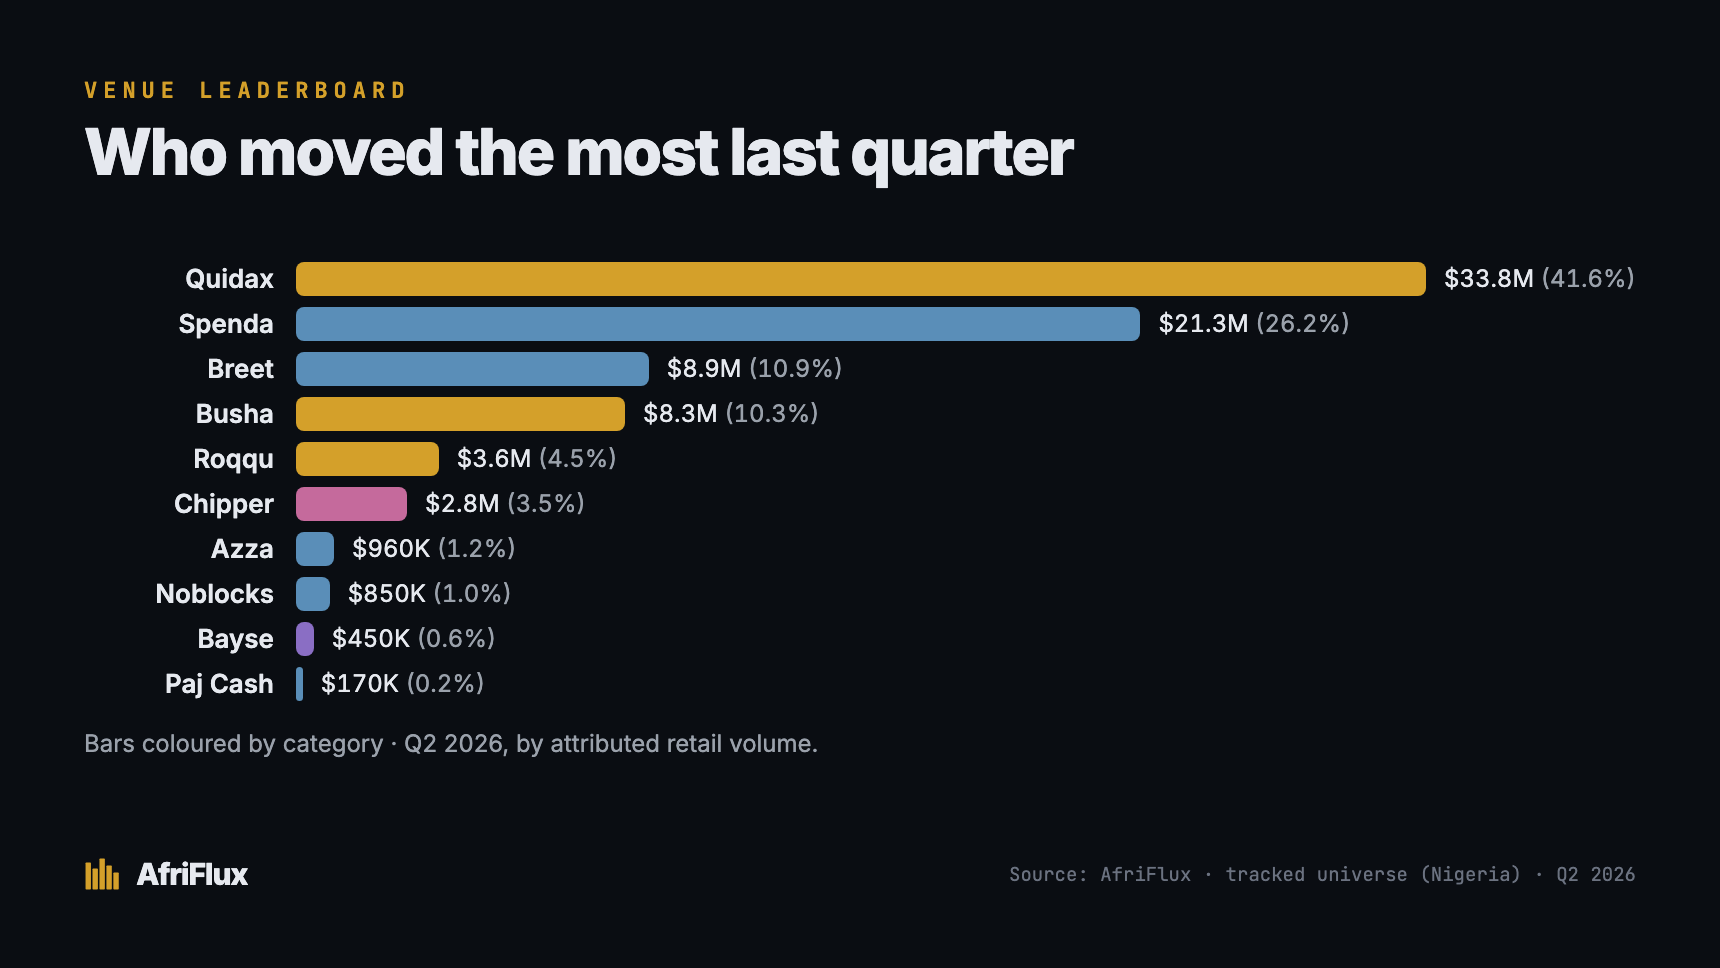
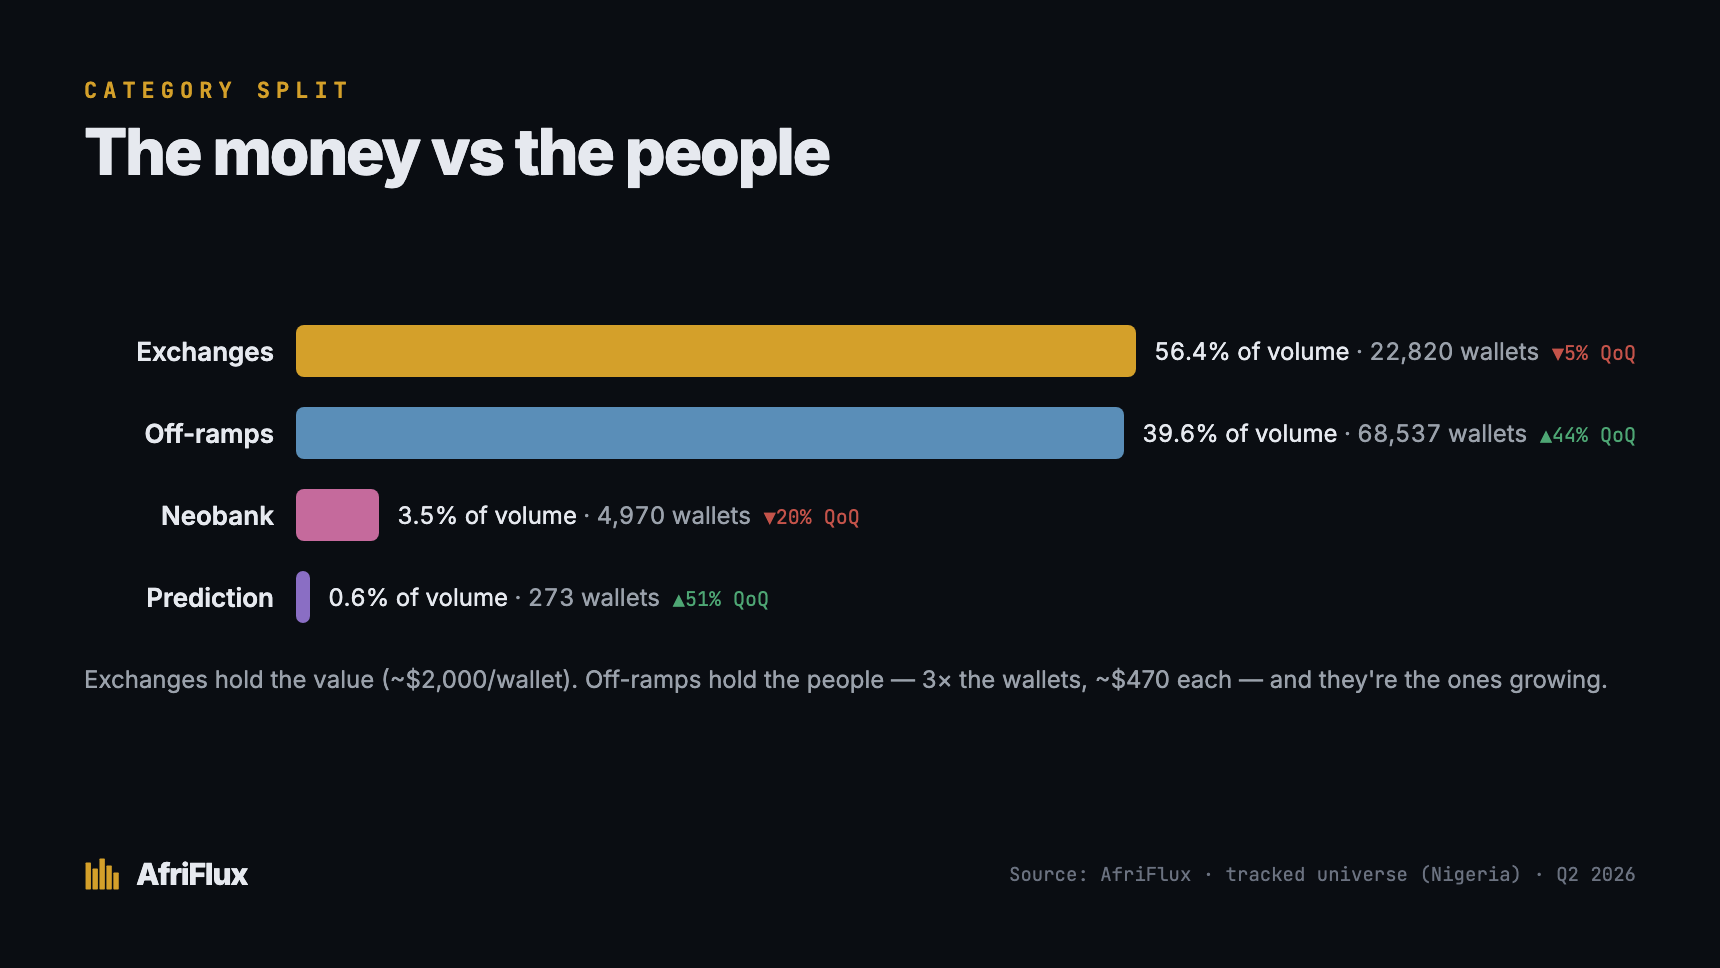
The money is on the exchanges. The people are on the off-ramps. Exchanges hold 56% of last quarter's volume across just 23,000 active wallets — roughly $2,000 a wallet. Off-ramps hold less volume, 40%, but spread it across 69,000 wallets — about $470 each. Three times the users, a quarter of the ticket size. The exchange leaderboard everyone quotes shows where the money pools. It completely misses where the people are: in the cash-out layer, moving small amounts, in enormous numbers. (What the data shows is the wallet-to-volume split. That those small tickets are mass retail converting to naira is our read of it — a confident one, but an inference, not a measurement.)
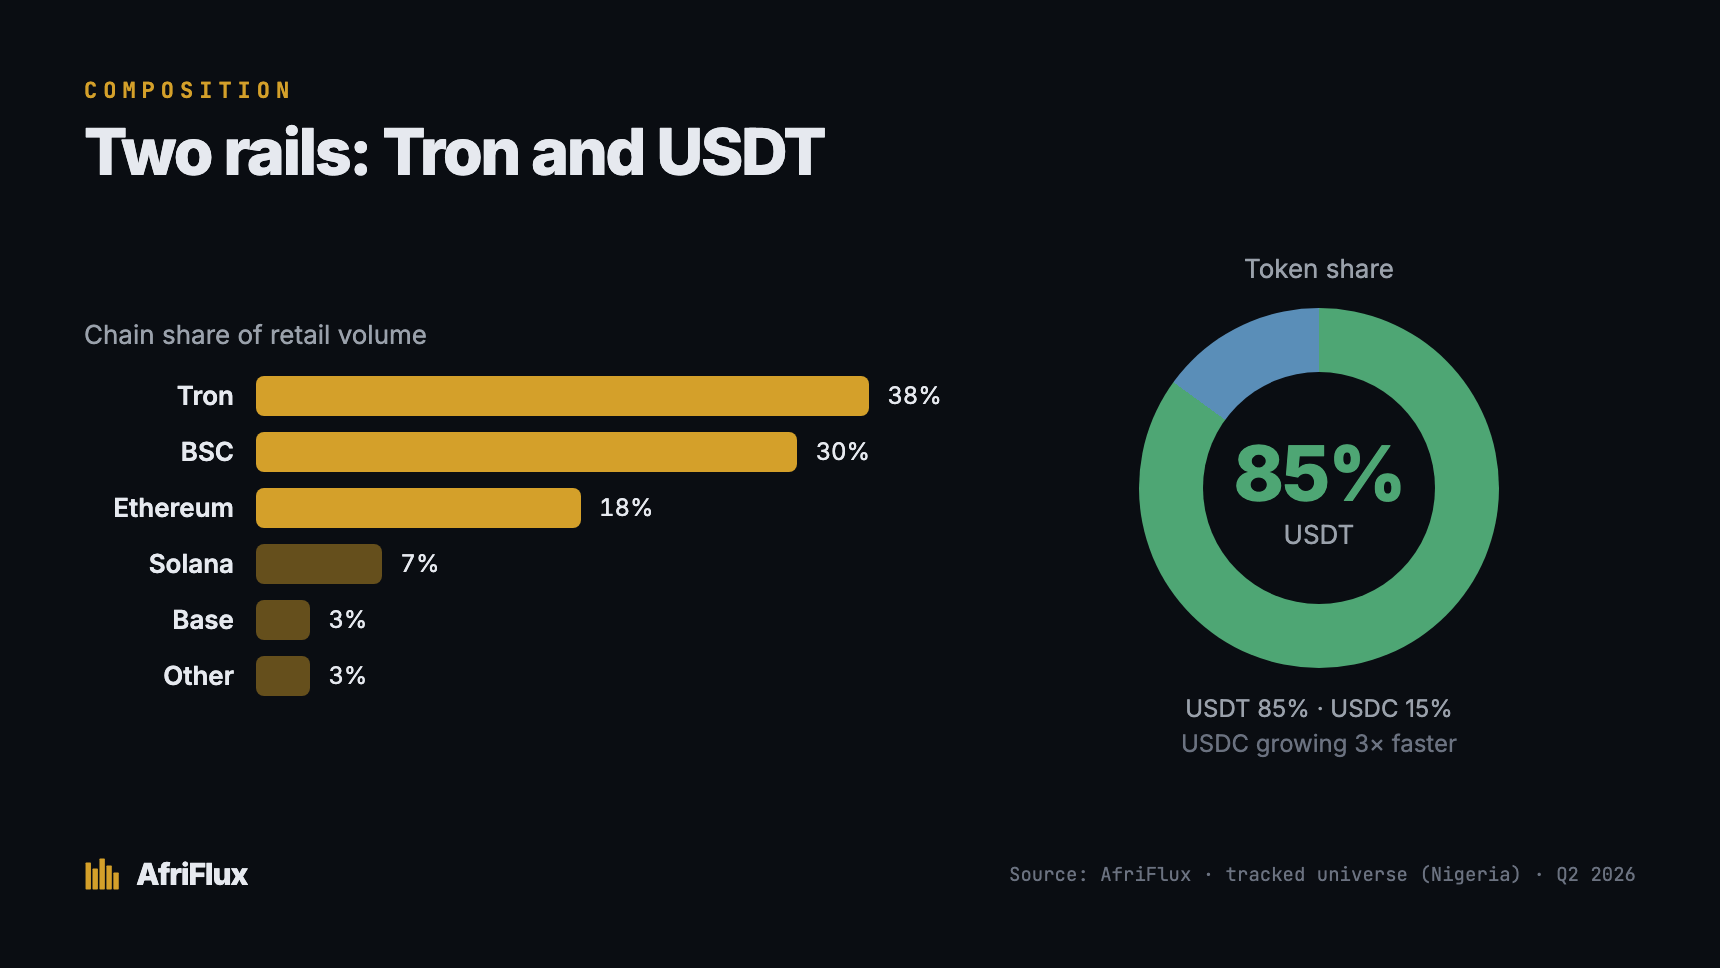
Nigerian retail runs on two rails: Tron and USDT. Tron alone carries 38% of quarterly volume; Tron, BSC and Ethereum carry 87% between them. On the asset side it's starker still — USDT is 85% of all retail flow, USDC just 15%. This isn't a diversified onchain economy. It's a concentrated one, built on the cheapest, most liquid dollar rail on offer. Everything else rounds to noise.
And underneath the concentration, the market is moving — away from the incumbents. Quarter over quarter, exchange volume fell 5% while off-ramp volume rose 44%. The names at the top of the leaderboard are flat or shrinking; the cash-out venues are the ones expanding — Breet more than doubled. One quarter is a signal, not a trend, so we're watching this rather than betting on it. But if the direction holds, off-ramps overtake exchanges as Nigeria's largest retail stablecoin category within a quarter or two.
So the real story isn't "Quidax is number one." It's that Nigerian stablecoin retail is a payment-and-cash-out economy — small tickets, USDT on Tron, huge numbers of people — and it's actively migrating toward the venues built for exactly that.
(Two venues stand alone in their categories: Chipper Cash is the only neobank we track, Bayse the only prediction market. We report them as individual venues, never as sector trends. One company isn't a sector.)
For the ecosystem
Independent measurement helps everyone who has had to run on anecdote:
- Founders benchmark themselves — real position instead of guessing: who's growing, who's stalling, where the users actually are.
- Investors understand markets — size the opportunity and check a pitch deck's user numbers against onchain reality.
- Journalists report accurately — independent, verifiable data in a space that has run on self-reported figures for far too long.
- Researchers analyze trends — attributed onchain flow they can interrogate, not extrapolation.
- Builders understand where activity is growing — a map of the rails people are moving toward, not the ones they've already left.
The common thread: decisions in this market have been made on anecdote. They don't have to be anymore.
What comes next
This is the floor, not the finished picture. Coverage expands in public from here — more venues, more chains, and more countries as we validate the attribution for each.
The next layer is the one almost nobody else covers: native African stablecoins — cNGN, ZARP, cKES and the issuers minting them. That's the sovereign side of this story, the part where the dollars on Tron start meeting locally-issued naira and rand onchain, and it lands on AfriFlux this week. Beyond that sits the settlement and infrastructure layer — the rails underneath the rails — which is where a lot of the most interesting flows quietly resolve.
Nigeria's stablecoin economy deserves to be seen
Public blockchains and DeFi take a certain transparency for granted — anyone can audit the flows, argue about the numbers, hold the data to account. Africa's stablecoin economy, the one moving real money for real people every single day, has had almost none of that. It's been measured in press releases.
This is the first measurement. It's a floor, it's Nigeria-first, and it will be wrong in places we'll correct in public. But it's real, it's onchain, and it's the start of treating this market like the serious thing it already is.
Method, in brief: figures cover the ten Nigeria-first venues AfriFlux currently tracks (USDT and USDC across ten chains). Volume is attributed retail inflow; a wallet counts as retail only after both its funding source and sweep destination are verified. Country is attributed at the venue level, not per wallet. Quarter-over-quarter figures compare the two most recent complete quarters — a single quarter is an early signal, not an established trend. Full methodology →