Blockradar's onchain footprint is $1.40B, and only 3.7% of it runs through venues we track
We mapped Blockradar's wallet infrastructure from onchain behaviour: $1.40B of observable flow across ten chains, 124 master wallets and 41,074 dedicated addresses. Most of it sits beneath businesses no venue dashboard shows.
- $1.40B
- Observable flow
- 88%
- On three chains
- 87.7%
- Carried by ten master wallets
- 3.7%
- Through venues we track
money in plus money out, sweeps between attributed wallets excluded
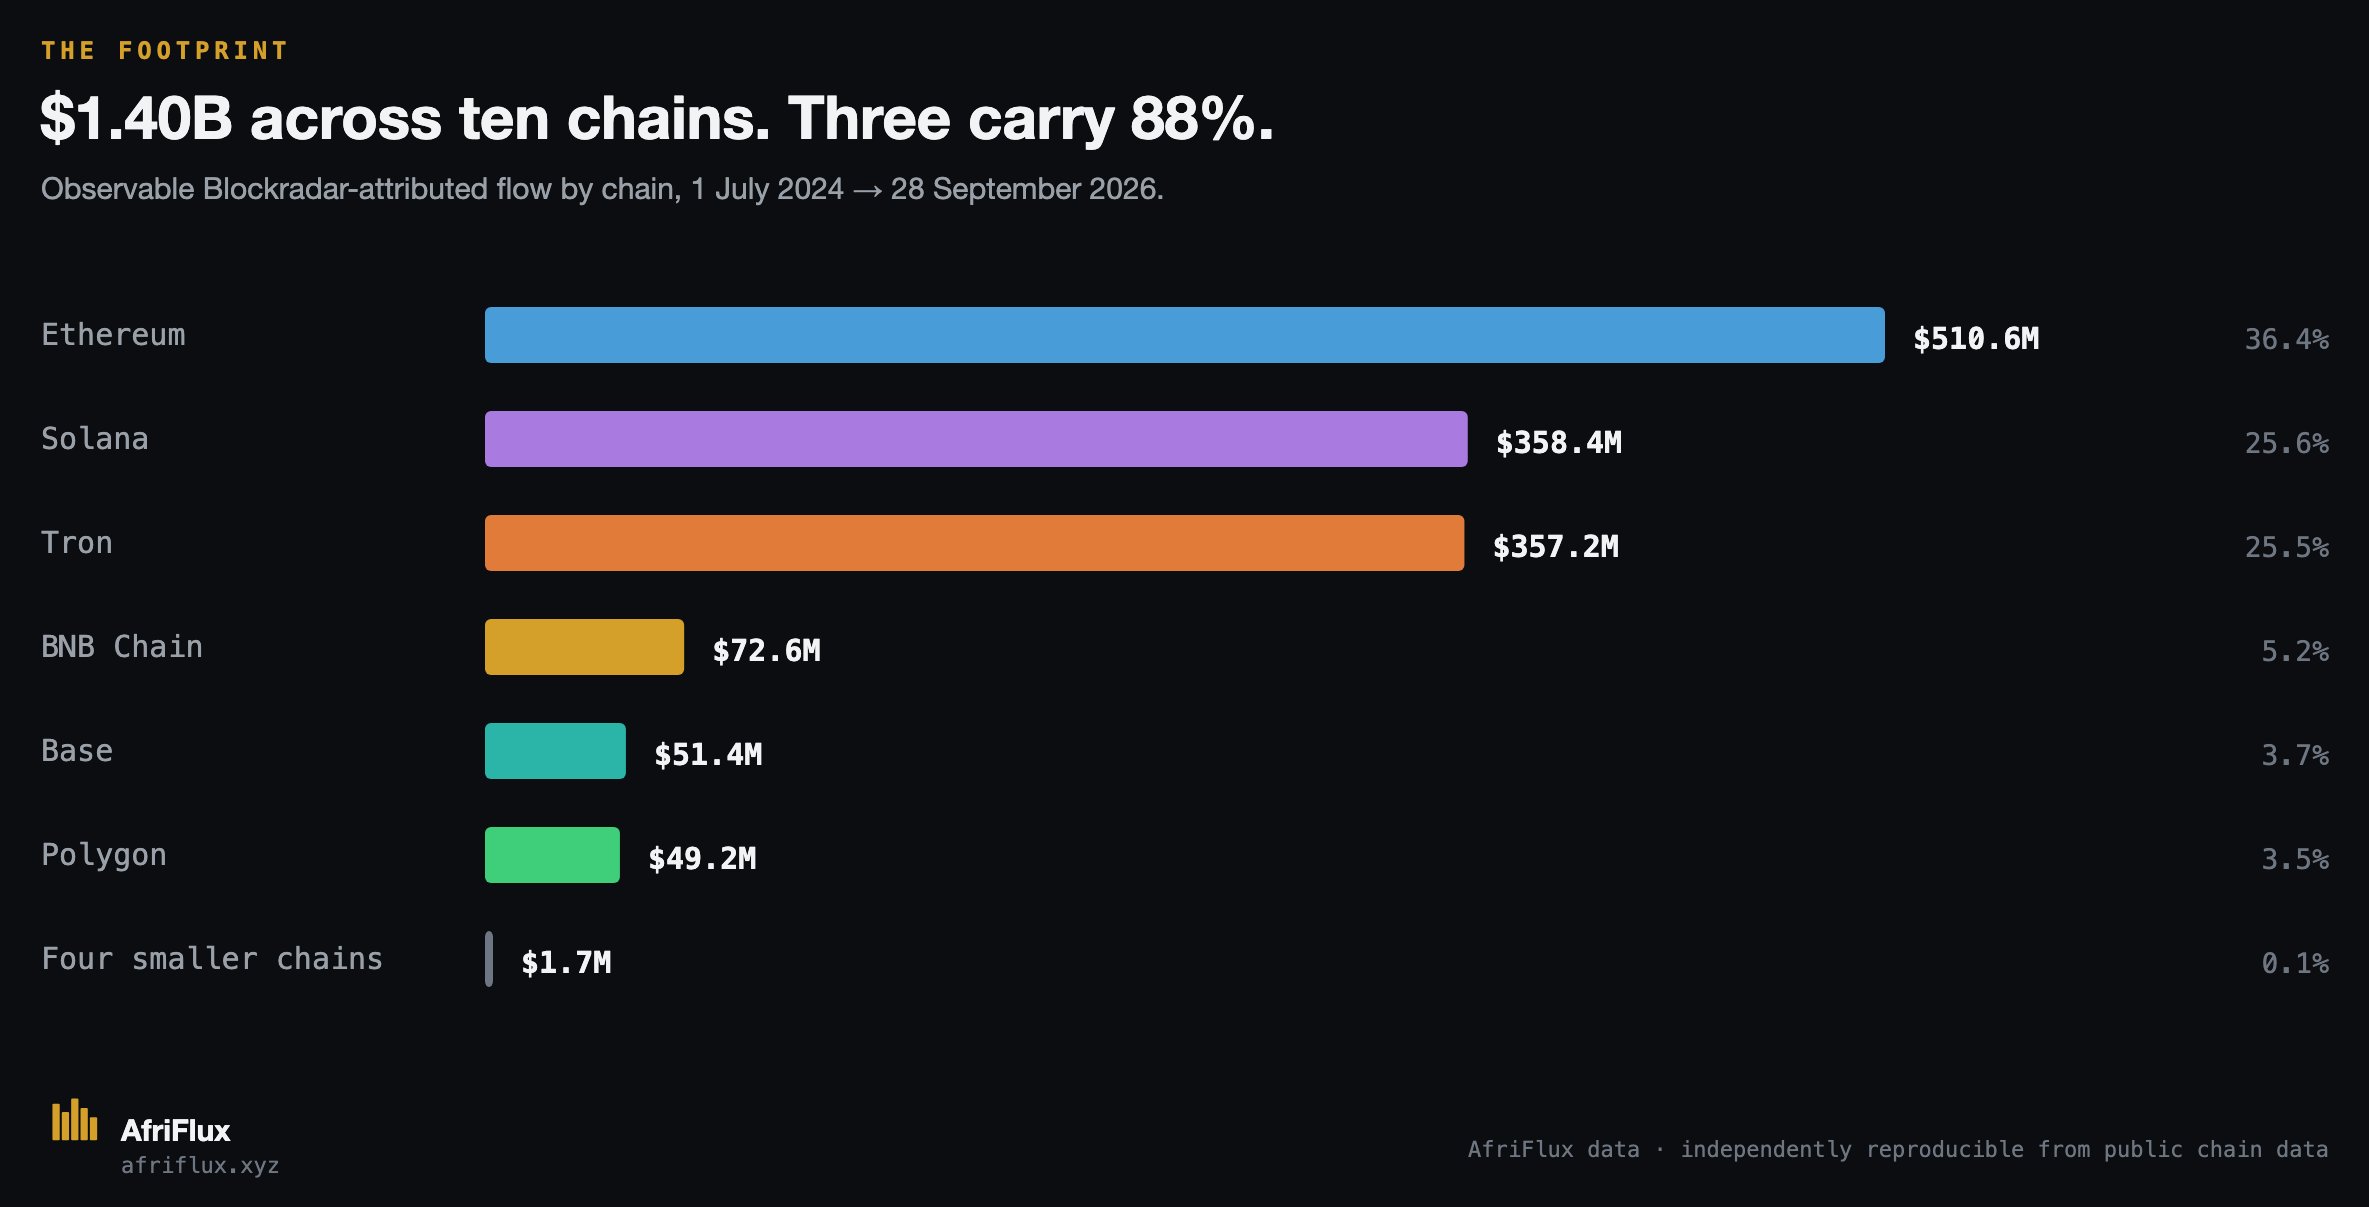
Ethereum $510.6M, Solana $358.4M, Tron $357.2M
124 master wallets mapped; master wallets are not customers
master wallets we can tie to venues already in AfriFlux coverage
Blockradar is infrastructure, not an exchange. Other businesses run their own master wallets on it, issue dedicated deposit addresses to their users and sweep what lands. There's no single Blockradar wallet holding the business, so we mapped the behaviour instead: the gas-funding and approve-and-drain pattern on EVM chains, fixed TRX funding on Tron, and a recurring compute-budget signature on Solana sweeps.
What the $1.40B is made of
Three chains carry 88% of the flow. By asset it's USDC at $867.5M and USDT at $521.7M, with cNGN contributing $11.6M, the largest African stablecoin on the rail.
A steep second act
Monthly flow sat around $1–4M through 2024. It jumped from $45.4M to $126.5M in May 2026 and reached $247.8M in August; cumulative flow crossed $1 billion on 10 August. 54 of the 124 master wallets we mapped first appear in 2026. The ten largest carry 87.7% of the flow.
Outside the venue layer
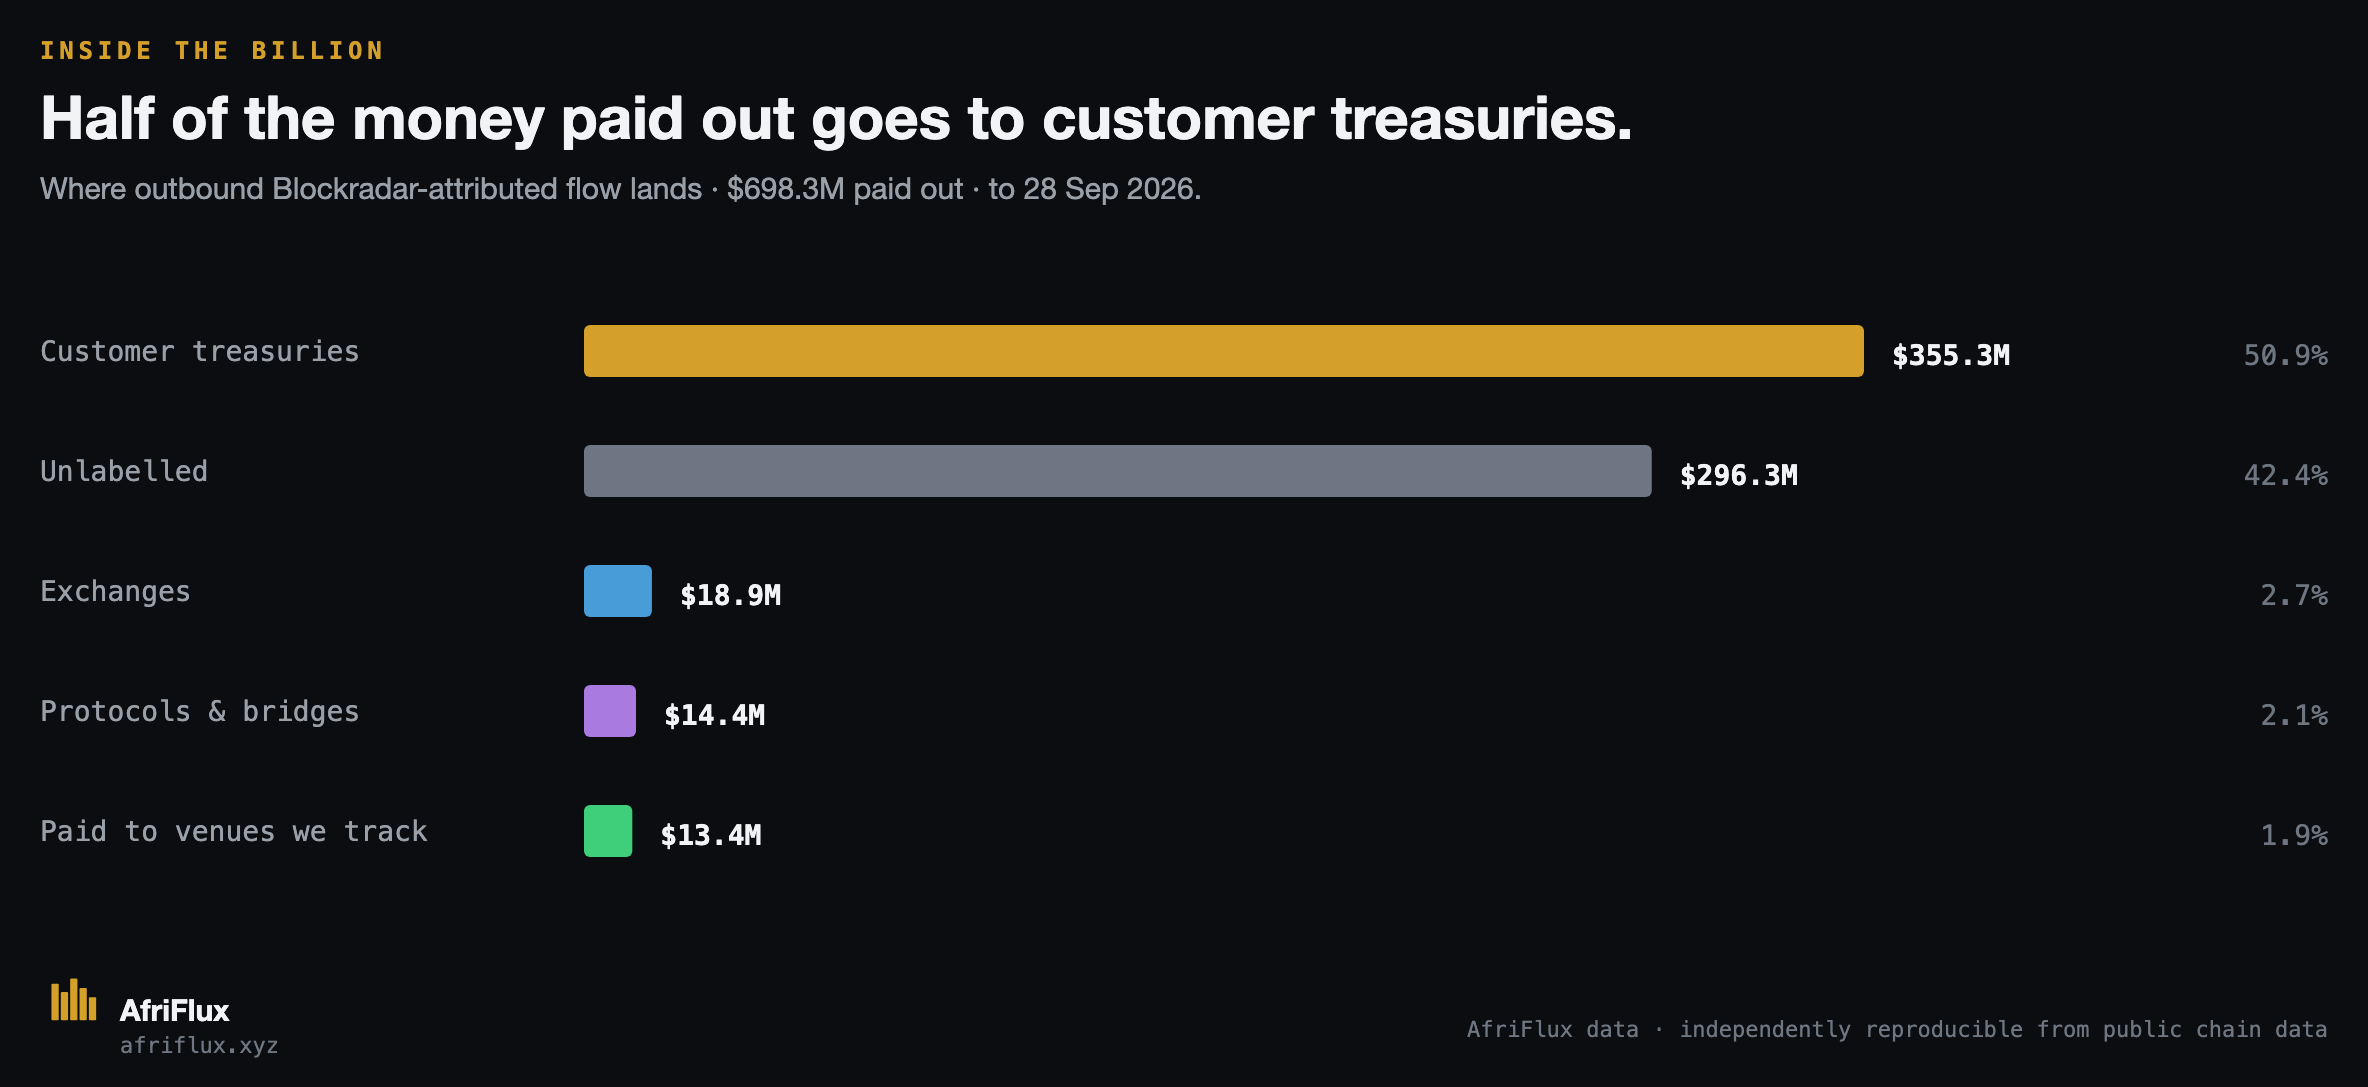
Half of what leaves Blockradar-attributed wallets goes to customer treasuries, and another 42.4% to addresses we can't confidently label. Only 3.7% of the measured flow runs through master wallets we can tie to venues already in AfriFlux coverage.
This is infrastructure flow, so it overlaps venues we already count and is never added to market totals.
Method
Stablecoin flow into and out of wallets attributed to Blockradar infrastructure by their onchain behaviour, 1 July 2024 to 28 September 2026, across ten chains; transfers between attributed wallets are excluded. It is not market volume, revenue or a customer count, and addresses that never leave the operational fingerprint are outside the measurement.
How attribution works →Cite this
Free to cite with attribution. No embargo, no approval needed.
AfriFlux (2026). Blockradar's onchain footprint is $1.40B, and only 3.7% of it runs through venues we track. Published 30 September 2026. https://www.afriflux.xyz/feed/blockradar-140b-onchain-footprint
Reproducing a chart? Use this line: Source: AfriFlux — on-chain intelligence for Africa's stablecoin economy. afriflux.xyz