Blockradar is not an exchange. It is infrastructure: wallets, deposit addresses, sweeps and payment rails that other businesses build on top of.
On 20 August, Blockradar announced that it had processed its first $1 billion in transaction volume and pointed users to its public dashboard.
We wanted to understand what that kind of infrastructure looks like from the outside.
So we mapped the wallet behaviour across ten chains and followed the money through the infrastructure it leaves behind.
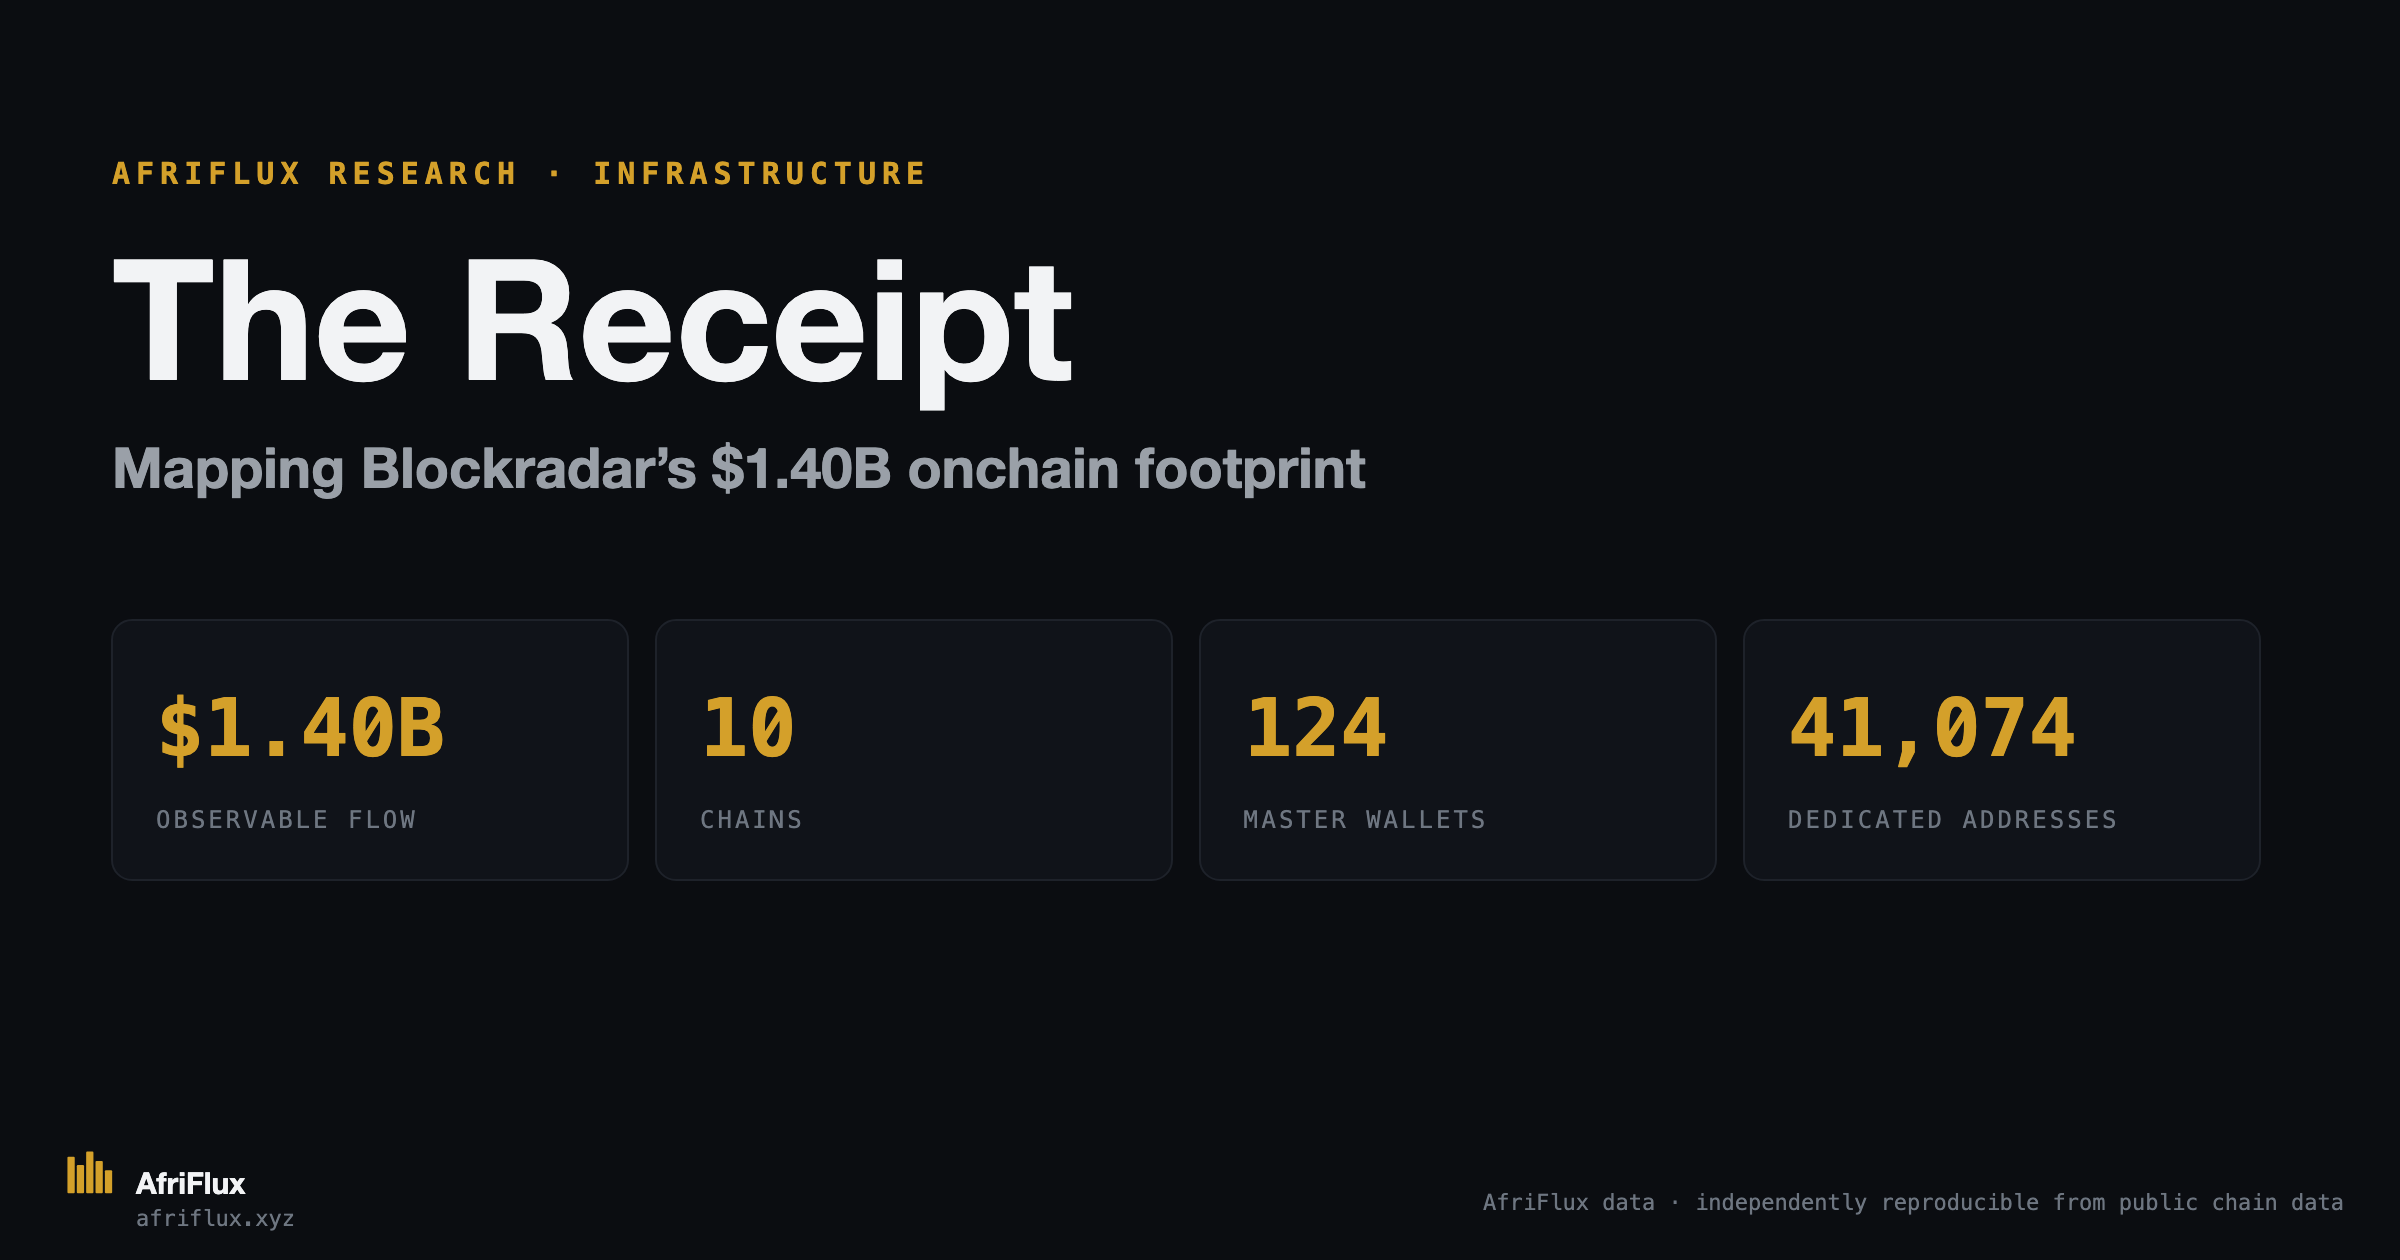
By 28 September, our observable footprint stood at $1.40 billion.
That number is not a customer book, a revenue figure or a market-size estimate. It is the flow we can attribute to the Blockradar infrastructure we mapped.
And once you follow it, the interesting part is not the billion itself. It is what sits underneath it.
A wallet-as-a-service company leaves a different footprint
A crypto venue usually has a recognizable book. Customers deposit into addresses controlled by the venue; those funds are swept into treasury or operational wallets. The venue is the destination.
Blockradar is different. It provides wallet infrastructure to other businesses. Those businesses can run their own master wallets, generate dedicated deposit addresses for their users, fund those addresses with gas and sweep incoming assets into their own infrastructure.
There is therefore no single Blockradar wallet containing the whole business.
Instead, the infrastructure repeats itself. Across chains, the same wallet operations leave recurring patterns: how addresses are funded, how approvals are made, how assets are swept and how the infrastructure interacts with the chain.
The fingerprints
We didn’t start with a list of Blockradar wallets. We started with the behaviour.
On EVM, the same dedicated-address pattern repeats across the infrastructure: recurring gas funding, followed by the same approve-and-drain sequence.
Then we found something even more revealing.
In July 2025, one parameter in that transaction pattern changed across the observed infrastructure on the same day — a clear fingerprint of the same underlying wallet system.
Tron leaves a different mark. Dedicated addresses are repeatedly funded with the same fixed TRX amounts before their stablecoins are swept.
On Solana, the sweeps carry a recurring compute-budget signature.
Put those patterns together and you can start seeing the infrastructure rather than individual wallets.
We used those behaviours to group addresses into Blockradar-attributed infrastructure and then followed the money through them.
That gave us 124 master wallets, 41,074 dedicated addresses and $1.40B in observable flow across ten chains.
What the $1.40B is made of
Across ten chains, our observable Blockradar-attributed flow reached $1.40 billion by 28 September.
The footprint is remarkably concentrated: three chains carry 88% of the flow, while USDC and USDT account for almost all of the rest.
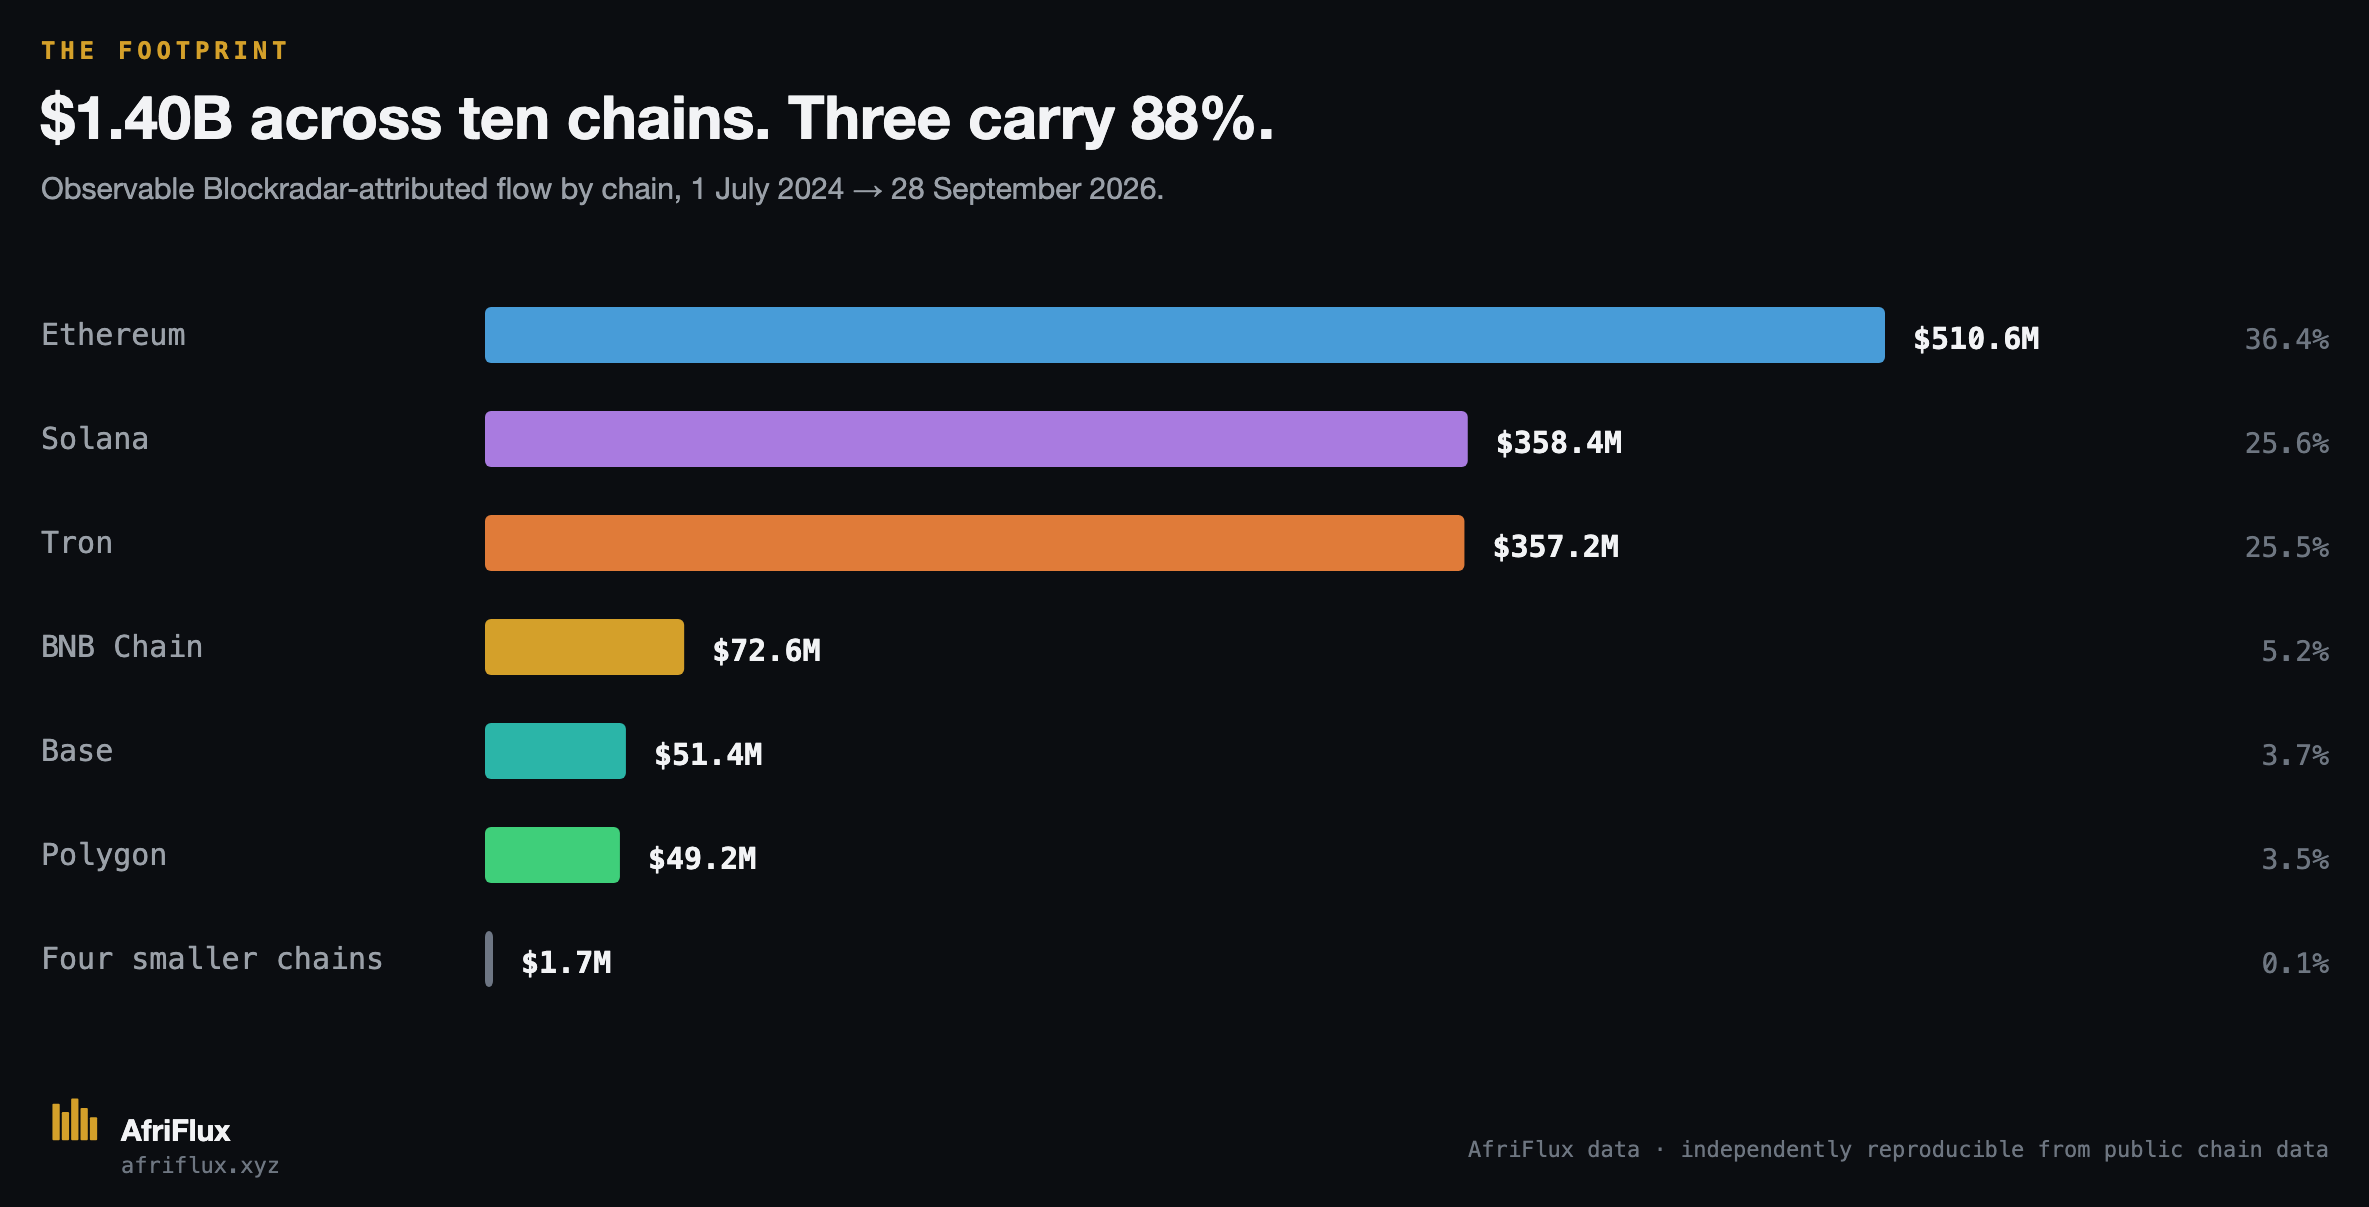
Ethereum, Solana and Tron alone account for 88% of the observable flow.
By asset, USDC accounts for $867.5M and USDT for $521.7M. cNGN contributes $11.6M — small relative to the dollar stablecoins, but significant as the largest African stablecoin on the rail.
The billion came in a steep second act
The footprint was relatively quiet through 2024. Monthly observable flow was generally in the $1–4M range.
Then the curve changed. In May 2026, monthly flow moved from $45.4M to $126.5M. August reached $247.8M.
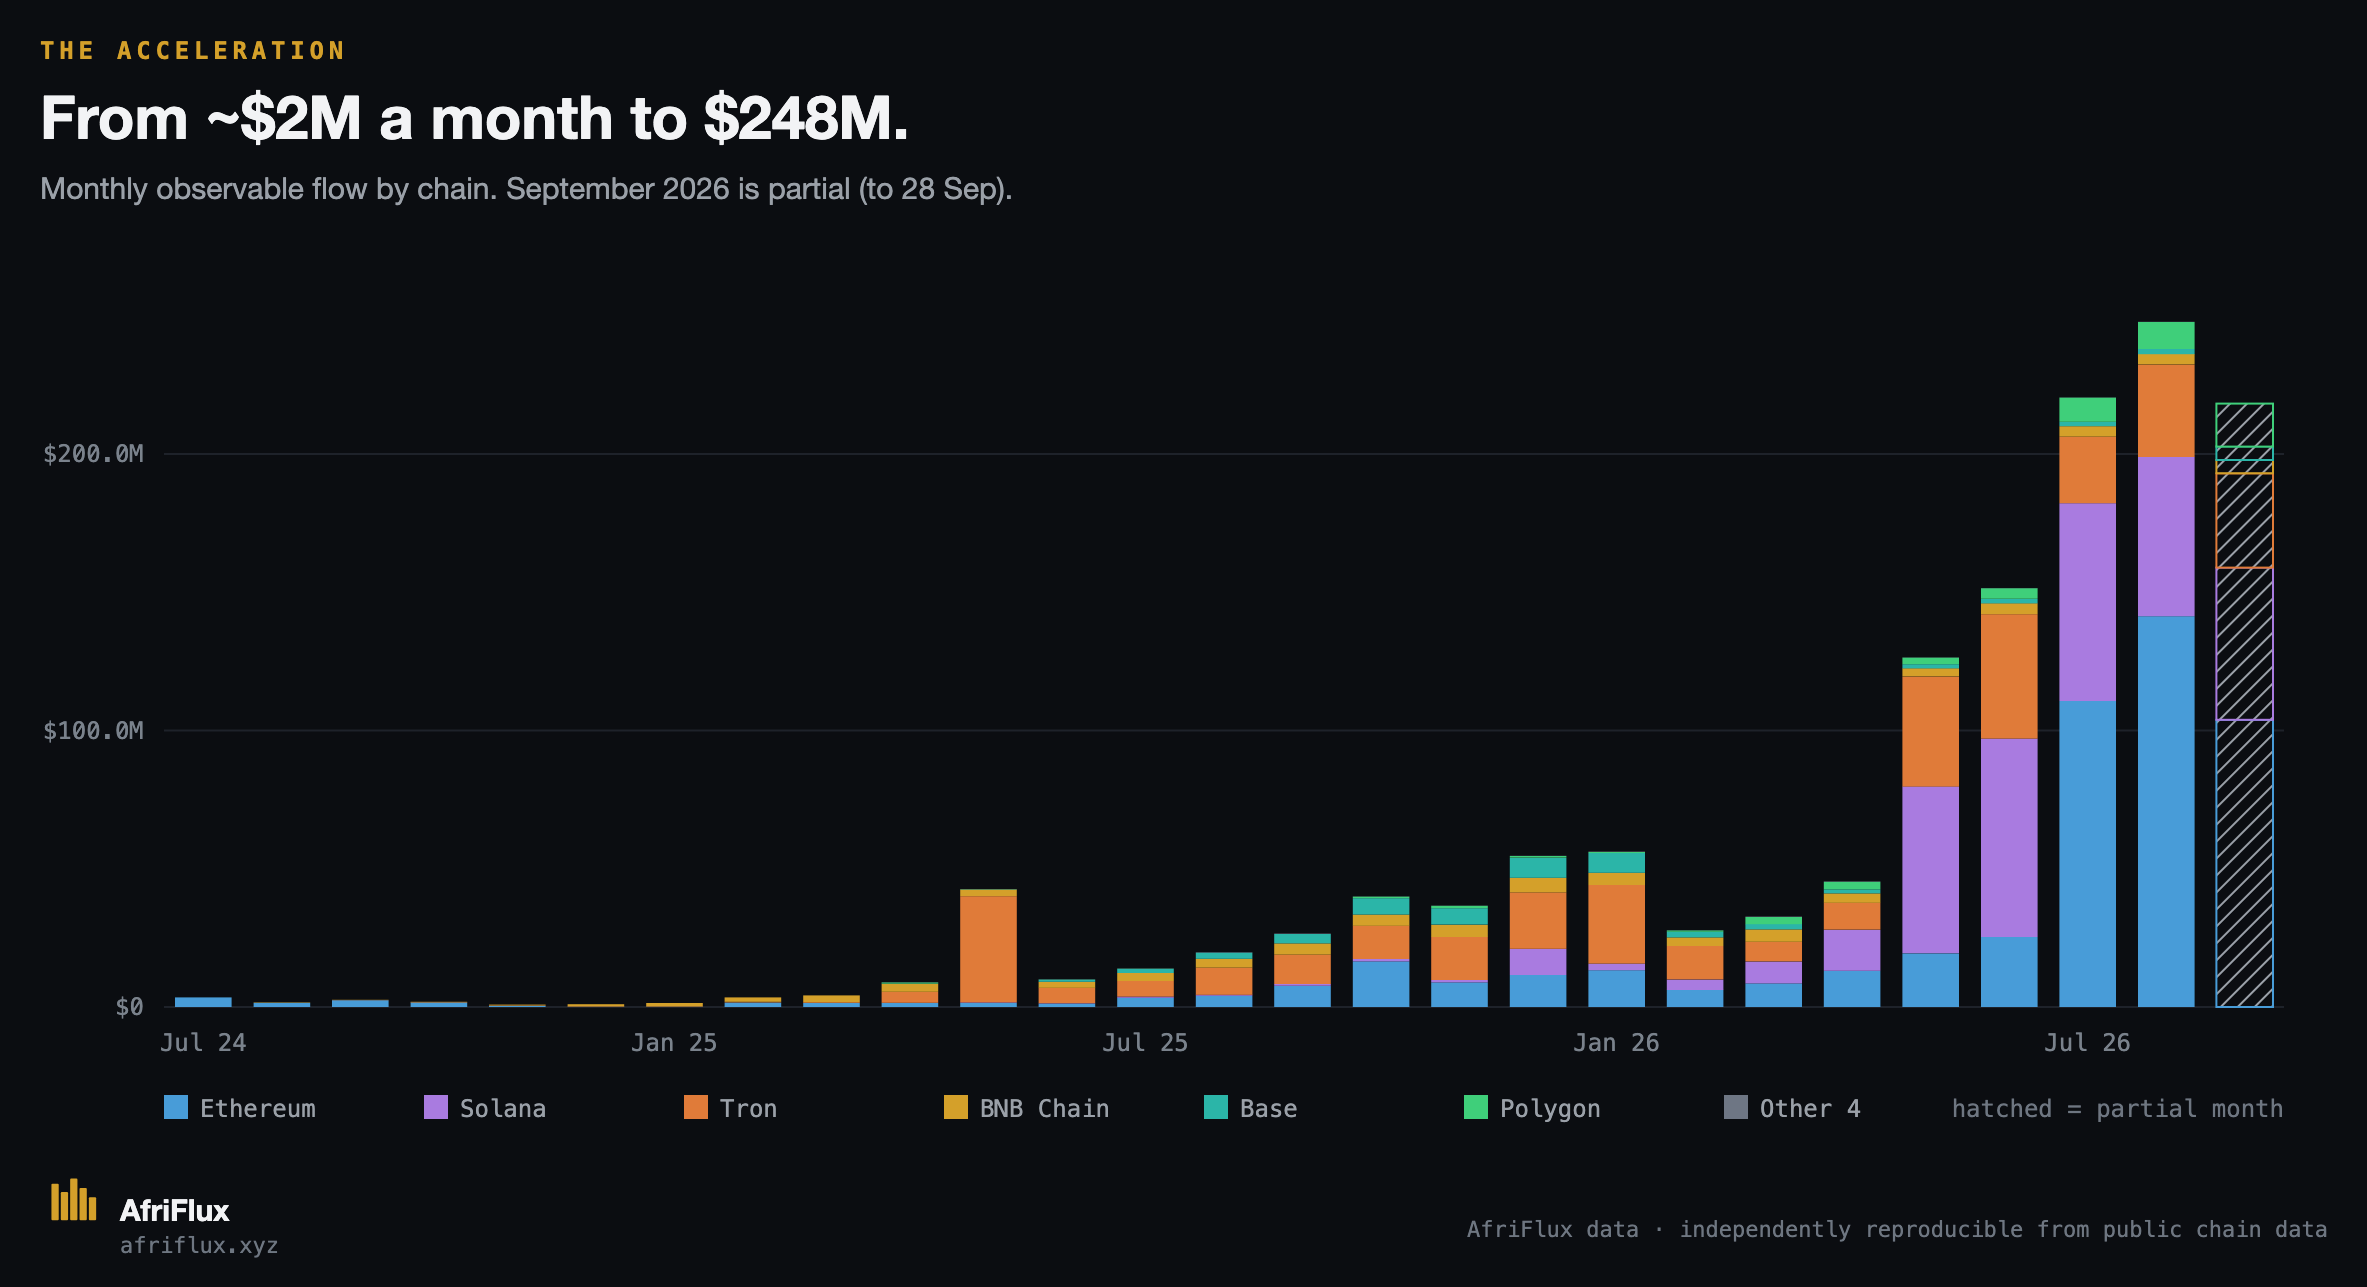
The growth was not simply one wallet getting bigger. New infrastructure appeared alongside larger existing operators: 54 of the 124 master wallets we mapped first appear in 2026.
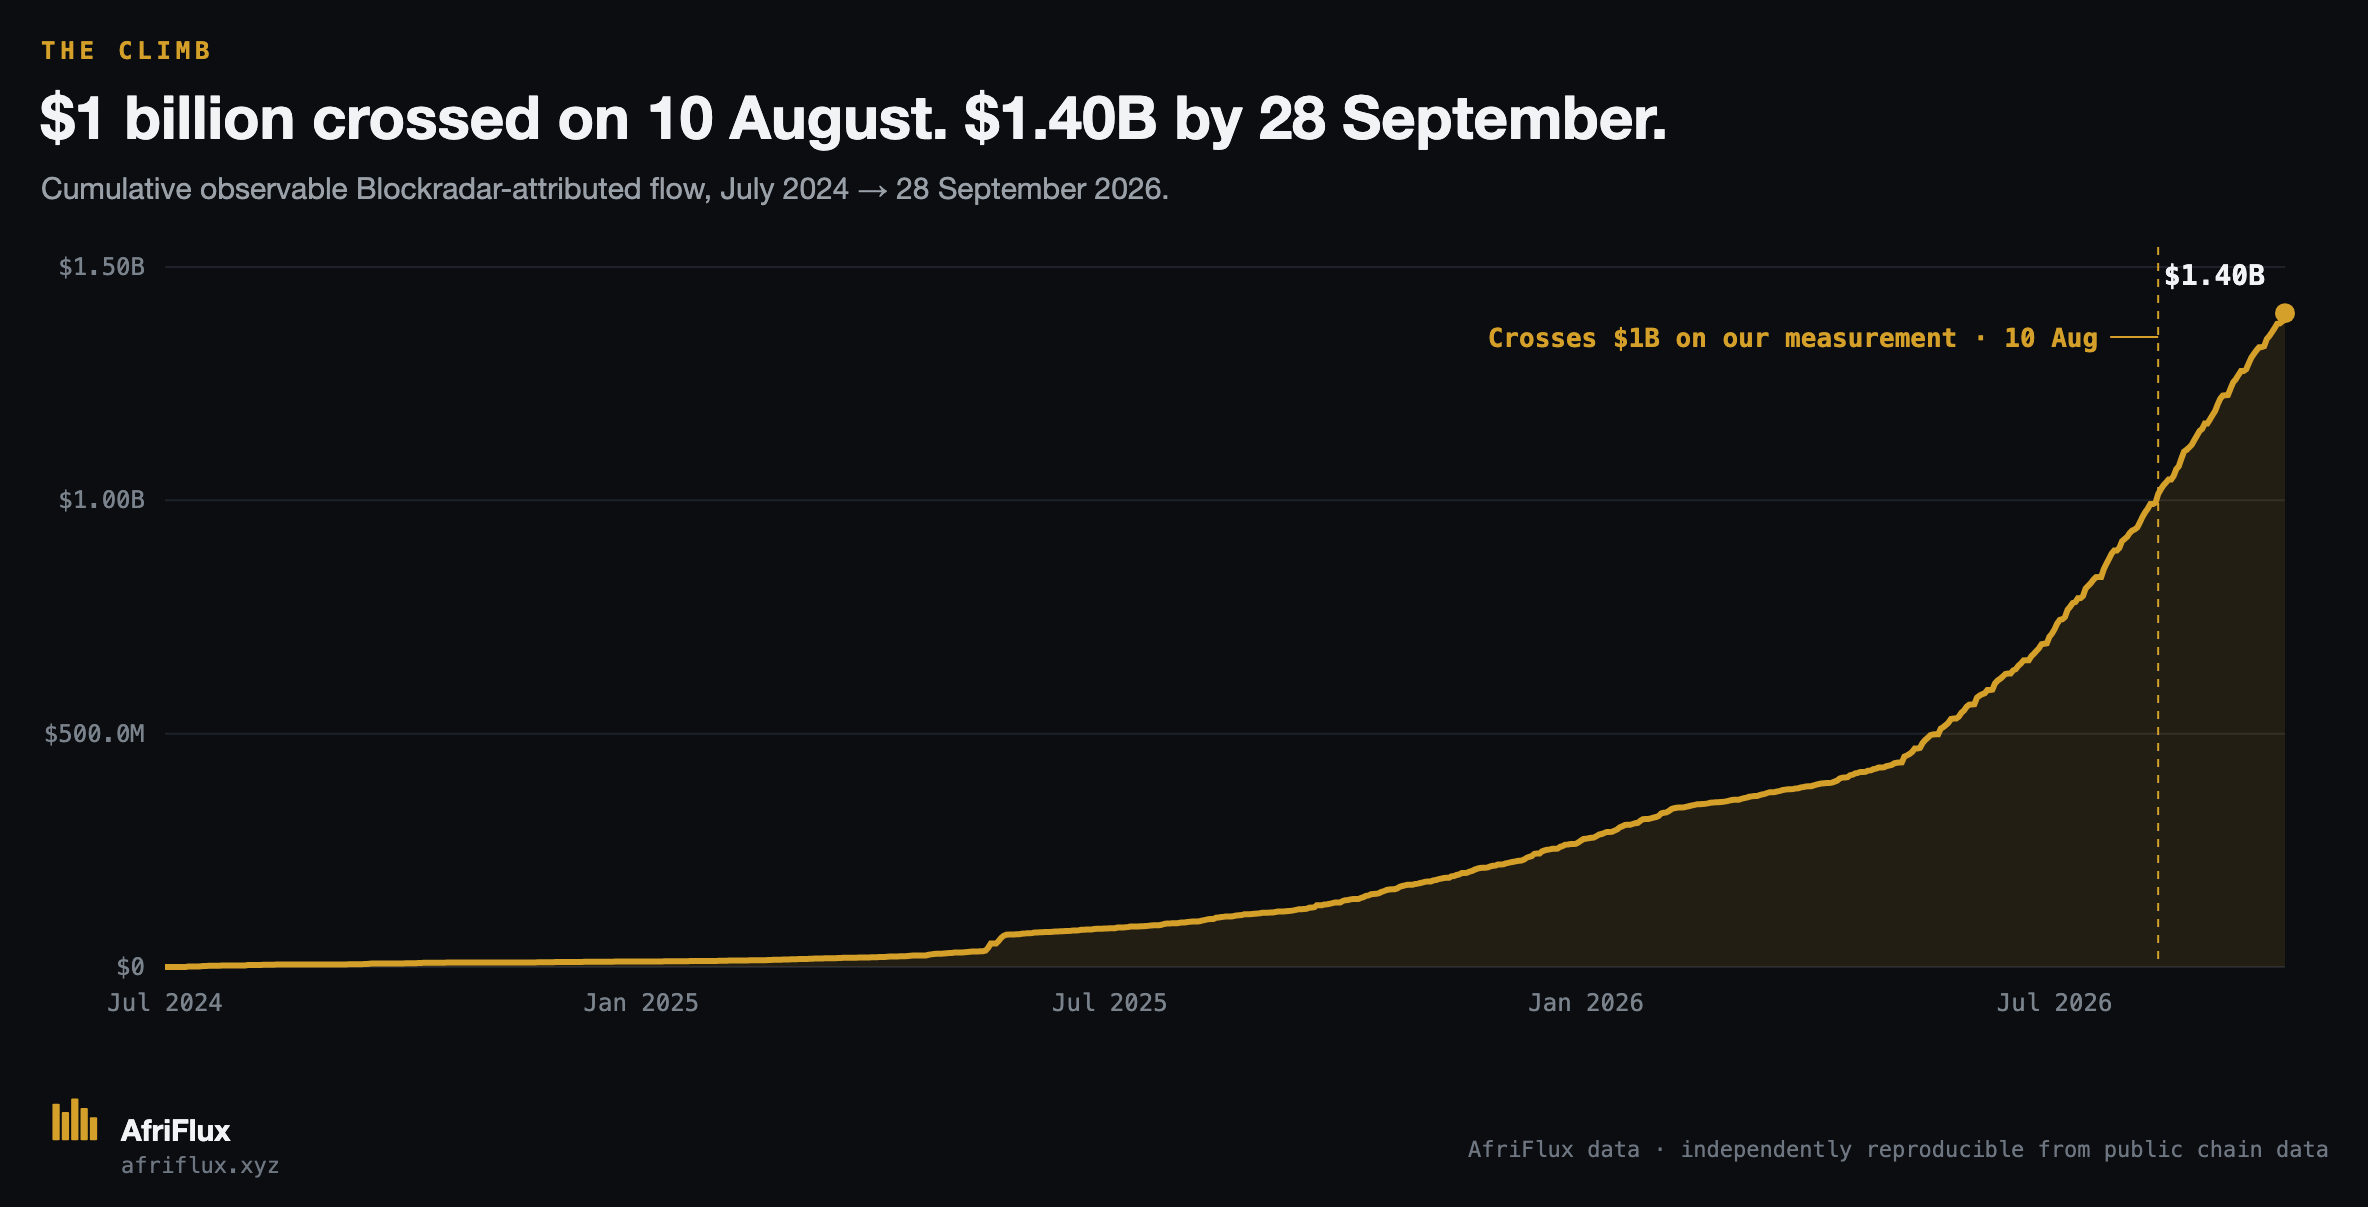
By our measurement, cumulative observable flow crossed $1 billion on 10 August and reached $1.40 billion by 28 September. The infrastructure didn’t slowly accumulate a billion. Something changed.
A few large operators sit above a long tail
The infrastructure is concentrated. The largest master wallet accounts for 25.4% of observable flow. The top five account for 71.7%. The top ten account for 87.7%.
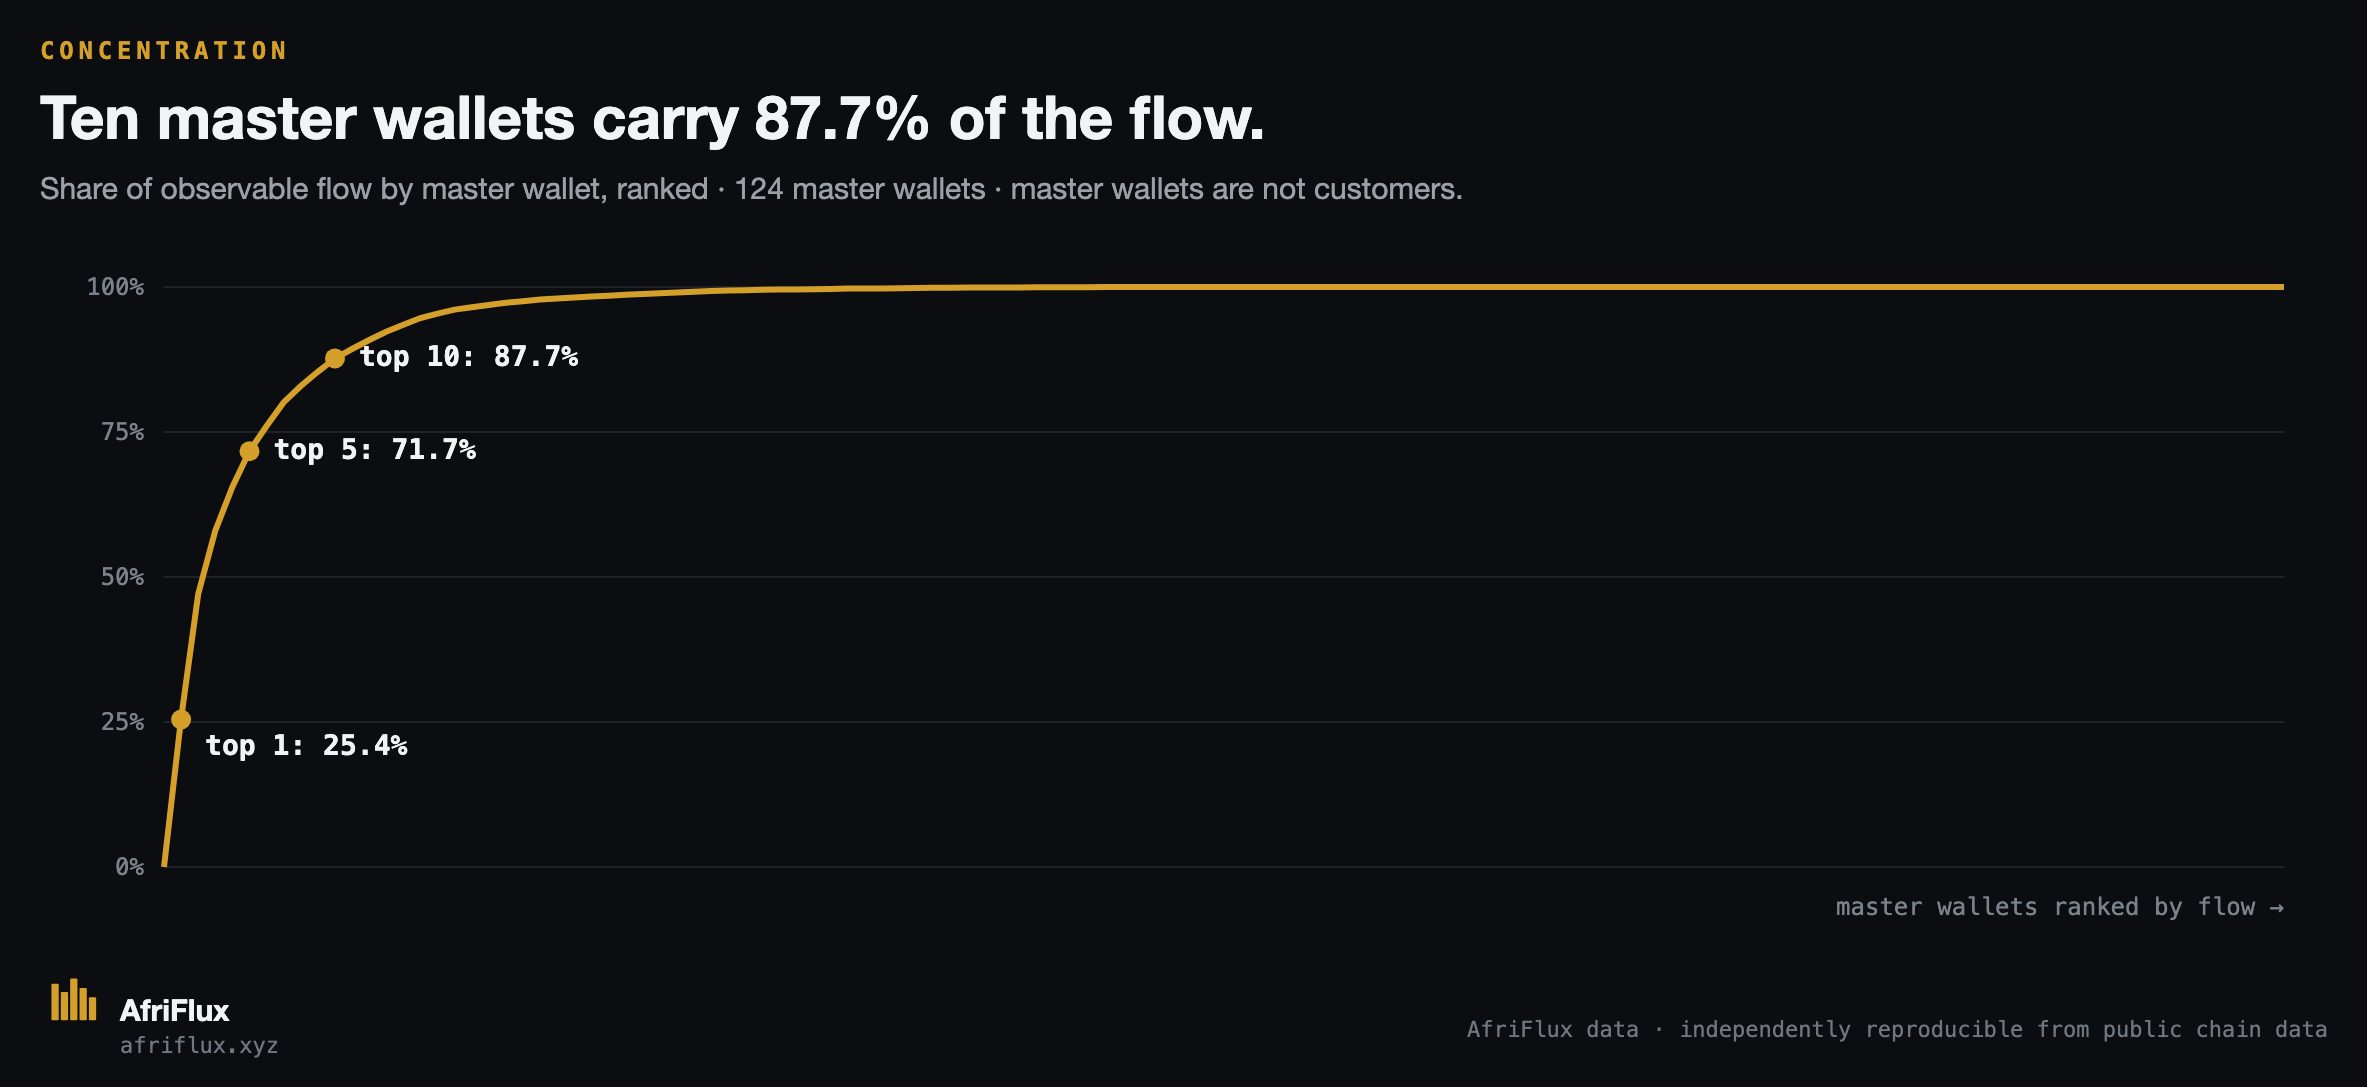
We call these master wallets, not customers. A business can operate several master wallets, and the chain does not give us a customer database.
The point isn’t customer concentration. It’s that a relatively small number of infrastructure objects carry most of the observable flow — and that a wallet-as-a-service platform can aggregate enormous amounts of it without there being one enormous public-facing wallet.
Most of the money ends up somewhere outside the venue layer
Following the money out of Blockradar-attributed wallets reveals another part of the story.
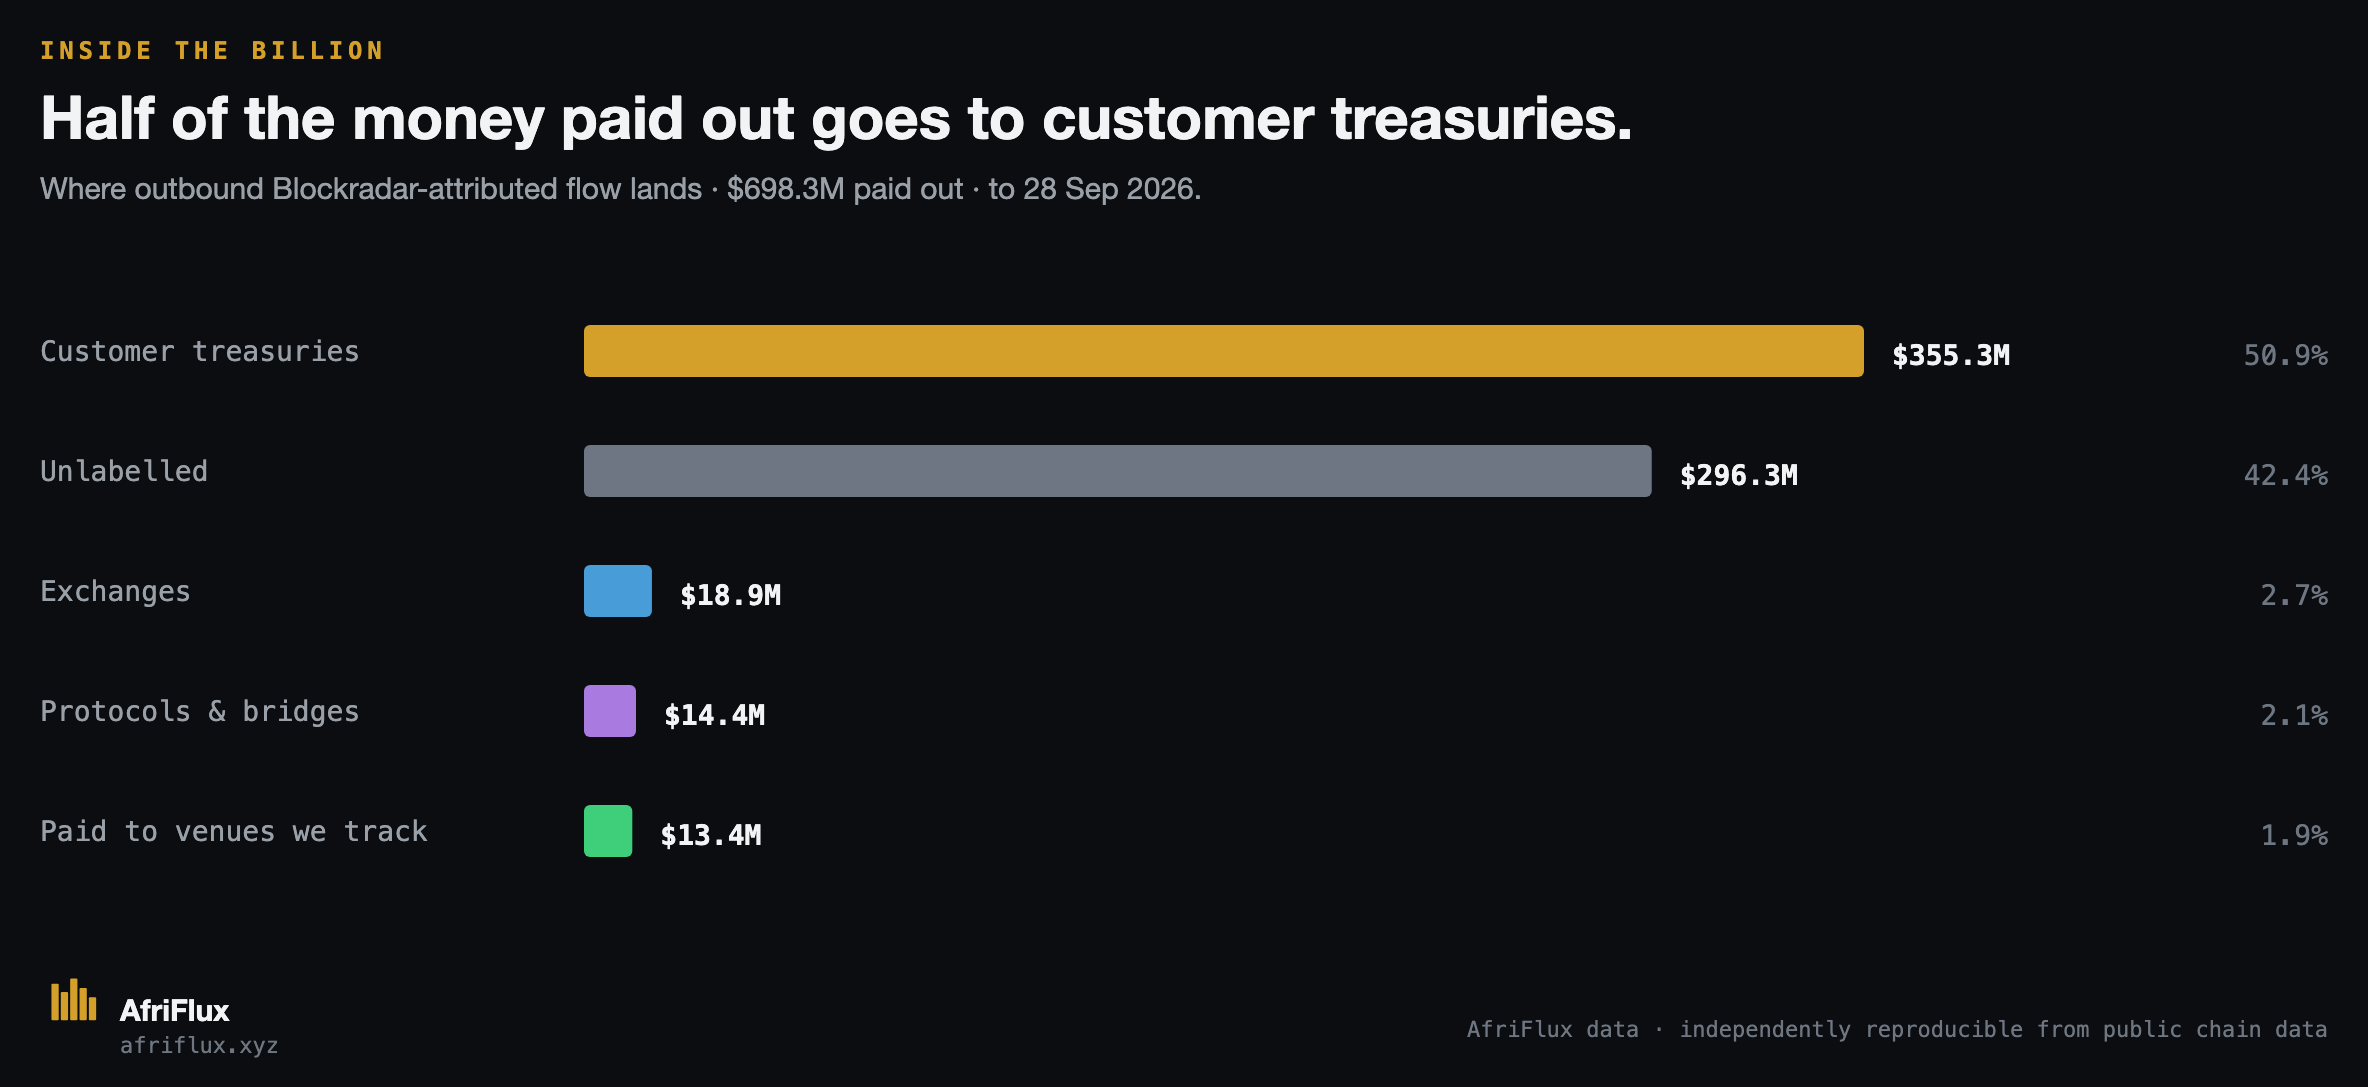
50.9% of outbound flow goes to customer treasuries: wallets that receive funds from the dedicated addresses associated with a single master and sit outside the Blockradar infrastructure we mapped.
Another 42.4% goes to addresses we cannot confidently label. Exchanges, protocols and venues in AfriFlux coverage account for the remaining share.
3.7% of our measured Blockradar flow runs through master wallets we can tie to venues already in AfriFlux coverage.
Most of this activity sits underneath businesses that a normal venue dashboard would never show you.
The bigger picture
We know the venues. We increasingly know the infrastructure underneath them. The interesting part is the gap between the two.
A wallet-as-a-service provider can carry a huge onchain footprint without ever looking like a venue.
Its customers may be exchanges, fintechs, payment companies, apps or other businesses. Their users see the product. The chain sees wallets underneath it.
Blockradar gives us a useful example of what happens when you map that layer directly.
The next layer of African onchain intelligence is not just mapping where people trade. It is mapping the infrastructure carrying the money.
What the $1.40B means
The $1.40B is the observable onchain flow we can attribute to the Blockradar infrastructure we mapped.
This is the part of the Blockradar footprint we can see from public-chain behaviour.
It is money moving into and out of attributed wallet infrastructure, measured from public-chain activity, aggregated across ten chains. It is a view of infrastructure flow, rather than a view of a single company’s customer ledger.
It is not African crypto market volume. It is not Blockradar revenue or profit. It is not customer balances. It is not a customer count, and it is not a count of people.
It is also not a measure of Blockradar’s overall business activity across every product.
What the chain cannot see
The map is built from behaviour. That also defines its limits.
- Addresses that don’t leave the fingerprint can’t be attributed.
- Customers using only payouts, virtual accounts or Checkout may not create the dedicated deposit-address pattern this analysis follows.
- Permit / EIP-3009 flows are outside the measurement.
- Gen 0 infrastructure is outside the measurement.
- Native-coin deposits are outside the measurement.
These are places where the public chain stops giving us enough evidence to make the attribution.
A billion dollars is easy to announce.
The interesting part is following the money far enough to see what the billion is actually made of.
Measure the flow. Map the infrastructure. Explain what the chain can — and cannot — see.
Get the next investigation in your inbox. The Sweep is our Monday newsletter — one attributed on-chain number a week, with the method attached. Subscribe →
Methodology & limits
Data runs from 1 July 2024 to 28 September 2026 across Ethereum, Solana, Tron, BNB Chain, Base, Polygon, Optimism, Arbitrum, Celo and Avalanche.
Scope is USD stablecoins supported by the mapped Blockradar infrastructure, plus cNGN priced at the daily naira rate. Flow is money in plus money out of attributed wallets. Transfers between attributed wallets are excluded.
Attribution is behavioural and rule-based per chain, built from the operational patterns those wallets leave behind on public chains.
Figures are current to 28 September 2026 and will move as coverage improves.