Chipper's volume grew 564%. Its users fell 28%.
Chipper's weekly volume is up 6.6x in ten weeks while its active wallets fell 28% and its deposit count fell 23%. The average deposit went from $100 to $862. Something changed in who is using it, not how many.
- +564%
- Volume
- -28%
- Active wallets
- -23%
- Deposit count
- 8.6x
- Average deposit size
$166,460 → $1,104,595 weekly
892 → 638 weekly
1,661 → 1,282 weekly
$100 → $862
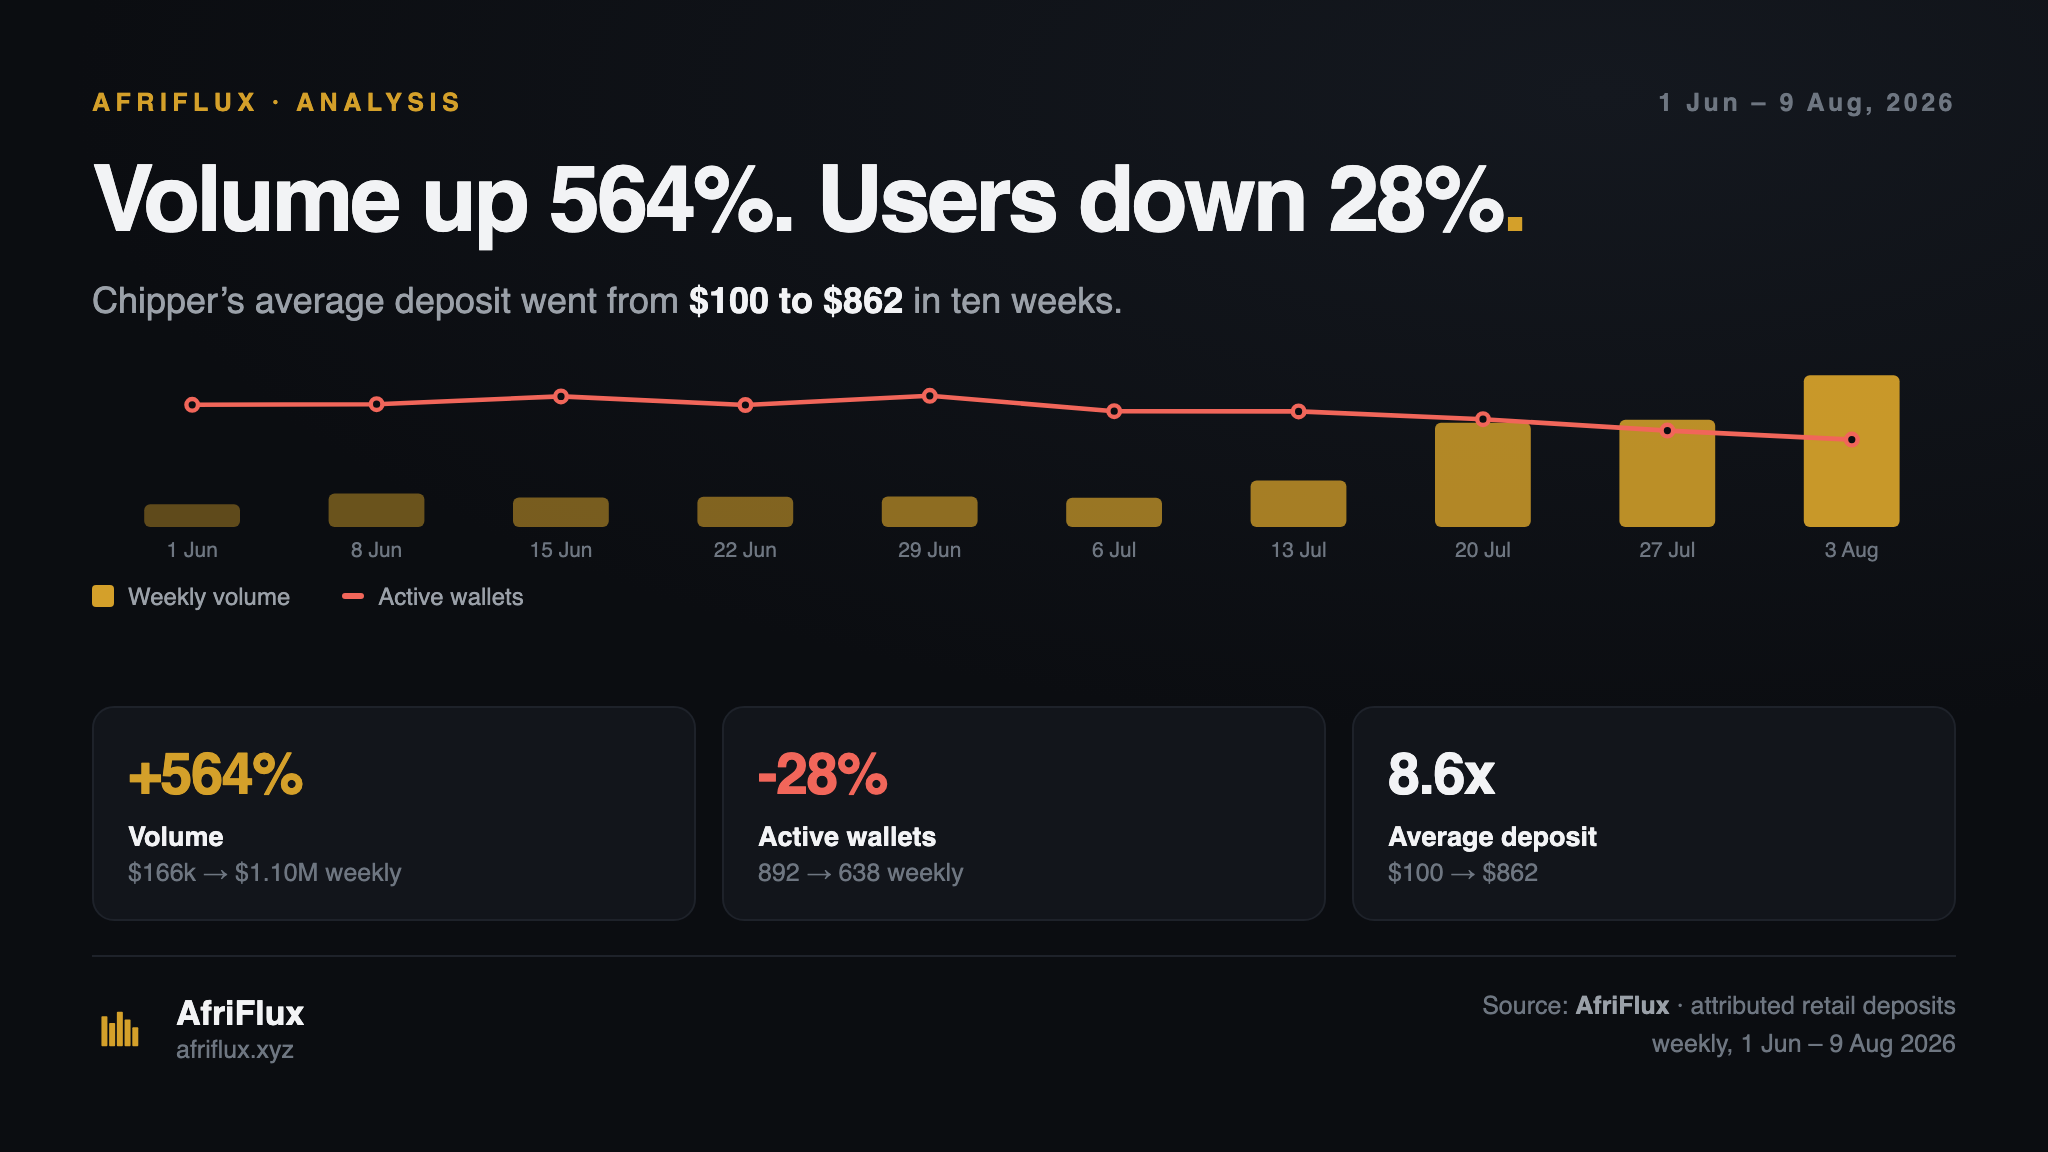
Chipper's weekly attributed deposit volume has gone from $166,460 to $1,104,595 since the start of June — up 564%, and its first week above a million dollars in 228 weeks of coverage.
Over exactly the same ten weeks, the number of addresses depositing into it fell from 892 to 638. Deposit count fell from 1,661 to 1,282.
| Week | Volume | Deposits | Wallets | Avg deposit |
|---|---|---|---|---|
| 1 Jun | $166,460 | 1,661 | 892 | $100 |
| 6 Jul | $212,618 | 1,576 | 845 | $135 |
| 13 Jul | $339,459 | 1,512 | 843 | $225 |
| 20 Jul | $758,480 | 1,623 | 786 | $467 |
| 3 Aug | $1,104,595 | 1,282 | 638 | $862 |
The average deposit went from $100 to $862. Nearly nine times larger, from 28% fewer people.
Growth and adoption are not the same measurement
A volume ranking puts Chipper third and rising, and stops there. It would tell you Chipper is winning. What it cannot tell you is that Chipper is doing more than six times the volume through fewer wallets than it had in June — which is a different business than the one it was running ten weeks ago, not a larger version of the same one.
We think this is the more useful reading, and it is the argument the Gradient framework exists to make: scale and momentum are separate axes, and a venue can climb one while the other moves the other way.
What we can't tell you
Deposit-side attribution sees addresses and amounts. It does not see who owns an address or why they deposited.
So there are at least two readings of this, and we cannot separate them from on-chain data alone:
Chipper won a higher-value cohort. Larger customers — traders, merchants, businesses — began routing through it, and the smaller retail flow simply didn't grow alongside.
Or a small number of large participants started using it. In which case the volume is real but concentrated, and it would leave as quickly as it arrived.
The wallet trend is consistent with either. What it is not consistent with is the story a volume chart implies — more people discovering a product.
One thing worth watching: if the second reading is right, the average deposit should stay high and wallet counts should stay flat or keep falling. If the first is right, wallet counts should stabilise and start climbing again as the new cohort widens. We'll report which way it goes.
Method
Attributed retail stablecoin deposits for Chipper, by ISO week, from the week of 1 June 2026 to the week of 3 August 2026. Deposit-side only — excludes withdrawals, transfers between venue-controlled addresses, and all off-chain activity. Active wallets counts distinct depositing addresses in the week; average deposit is weekly volume divided by weekly deposit count. Addresses are attributed to Chipper by on-chain infrastructure mapping, so a wallet here is a depositing address, not a verified customer account.
How attribution works →Cite this
Free to cite with attribution. No embargo, no approval needed.
AfriFlux (2026). Chipper's volume grew 564%. Its users fell 28%.. Published 10 August 2026. https://www.afriflux.xyz/feed/chipper-fewer-users-bigger-deposits
Reproducing a chart? Use this line: Source: AfriFlux — on-chain intelligence for Africa's stablecoin economy. afriflux.xyz