98.5% of cNGN's volume is infrastructure, not use
cNGN has moved ₦163 billion on-chain. Applying an adapted Visa × Allium method, only 1.5% of it — about ₦2.48B — looks like genuine arms-length economic activity. The rest is infrastructure moving money in circles.
- ₦163B
- Headline transfer volume
- 1.5%
- Organic activity
- 88%
- Of supply already burned
- 80%
- Of real use never touches a tracked venue
lifetime, on-chain
≈₦2.48B arms-length
₦2.5B net circulating
P2P or off-platform
cNGN has moved ₦163 billion in on-chain transfers.
But here's the question almost nobody is asking: how much of that is actual economic activity — and how much is just infrastructure moving money in circles?
Raw transfer volume measures movement. It does not measure usage. ₦163B moving between a treasury and its own operational wallets is fundamentally different from ₦163B moving between real businesses, merchants and users. Raw volume can't tell the difference.
So we applied the industry's closest thing to a standard — the framework Visa built with Allium to separate real stablecoin usage from noise — calibrated the thresholds to cNGN's actual scale, and added same-entity netting from the BIS.
What we found
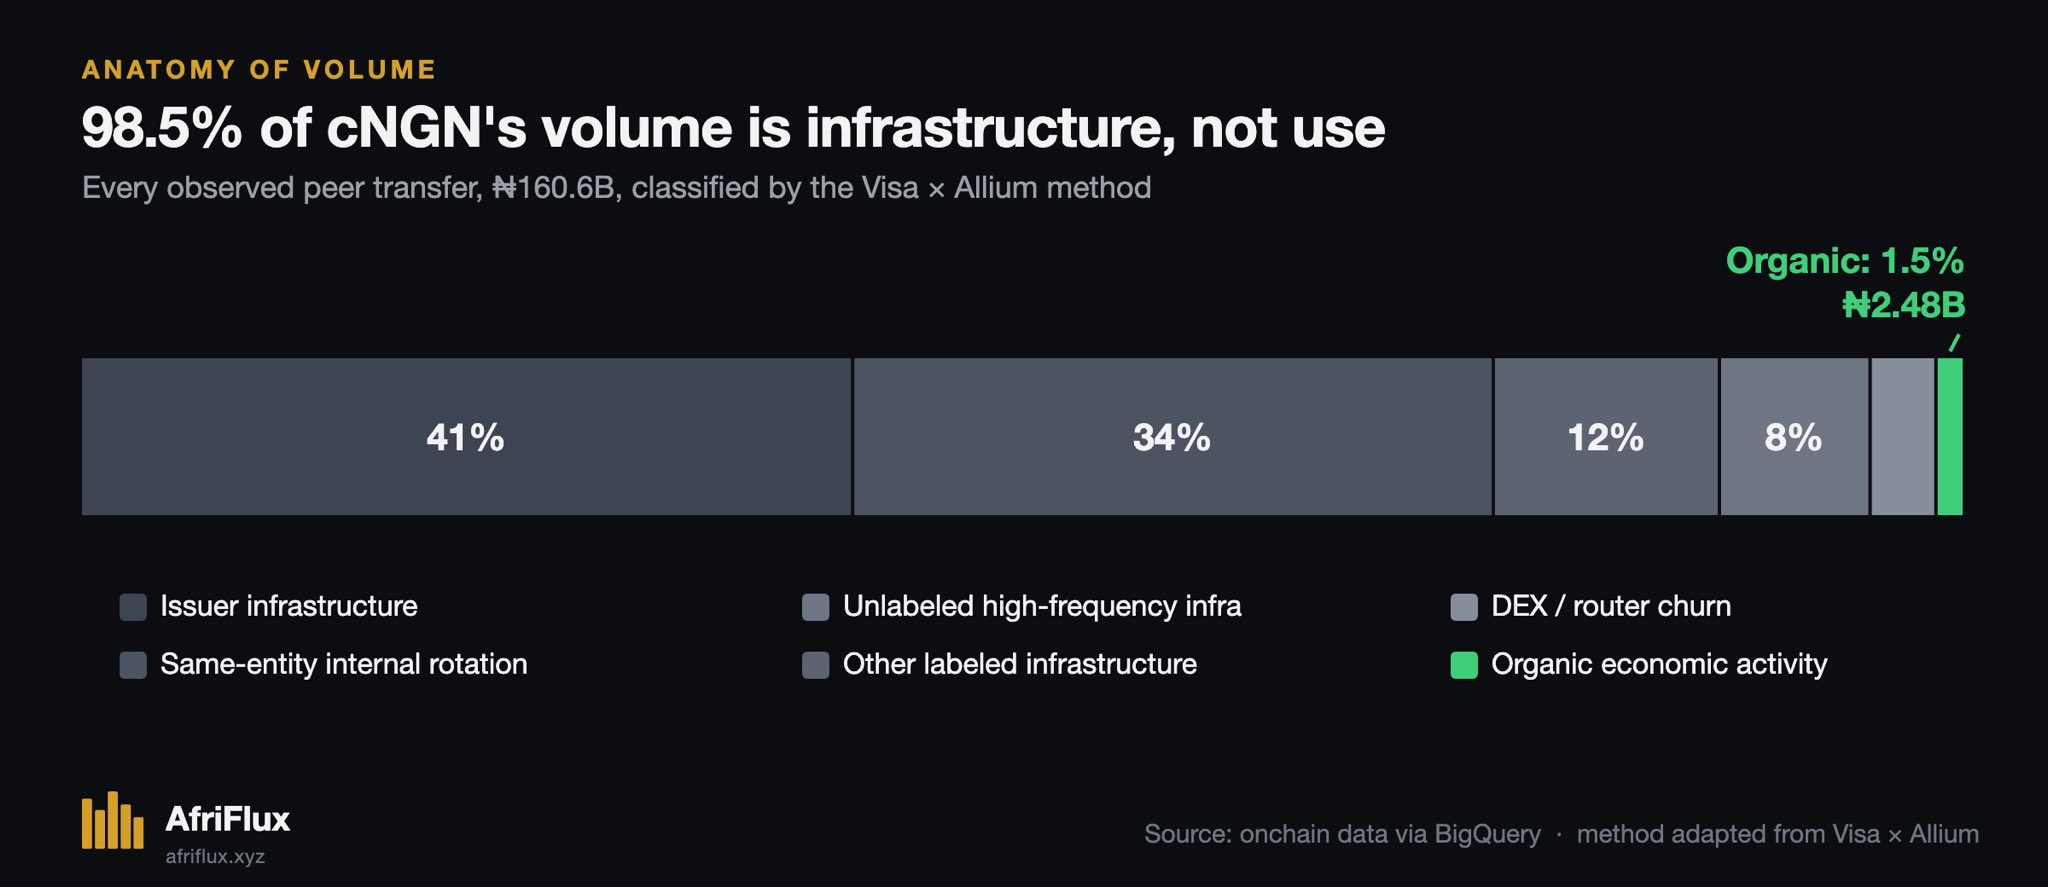
98.5% of cNGN's ₦163B volume is infrastructure. Only 1.5%, around ₦2.48 billion, looks like genuine arms-length transfers between independent parties. That's the difference between plumbing and actual water flowing.
Of that infrastructure slice: 41% is the issuer moving its own token through its own wallets, 34% is venues and the issuer shuffling funds between wallets they already control, and 23% is exchange hot wallets, bridges, routers and DEX bots.
Headline volume grew roughly 130x since the early days. Real organic activity stayed small and relatively flat for most of the token's life. The grey bars climbed a mountain; the green line stayed in the foothills.
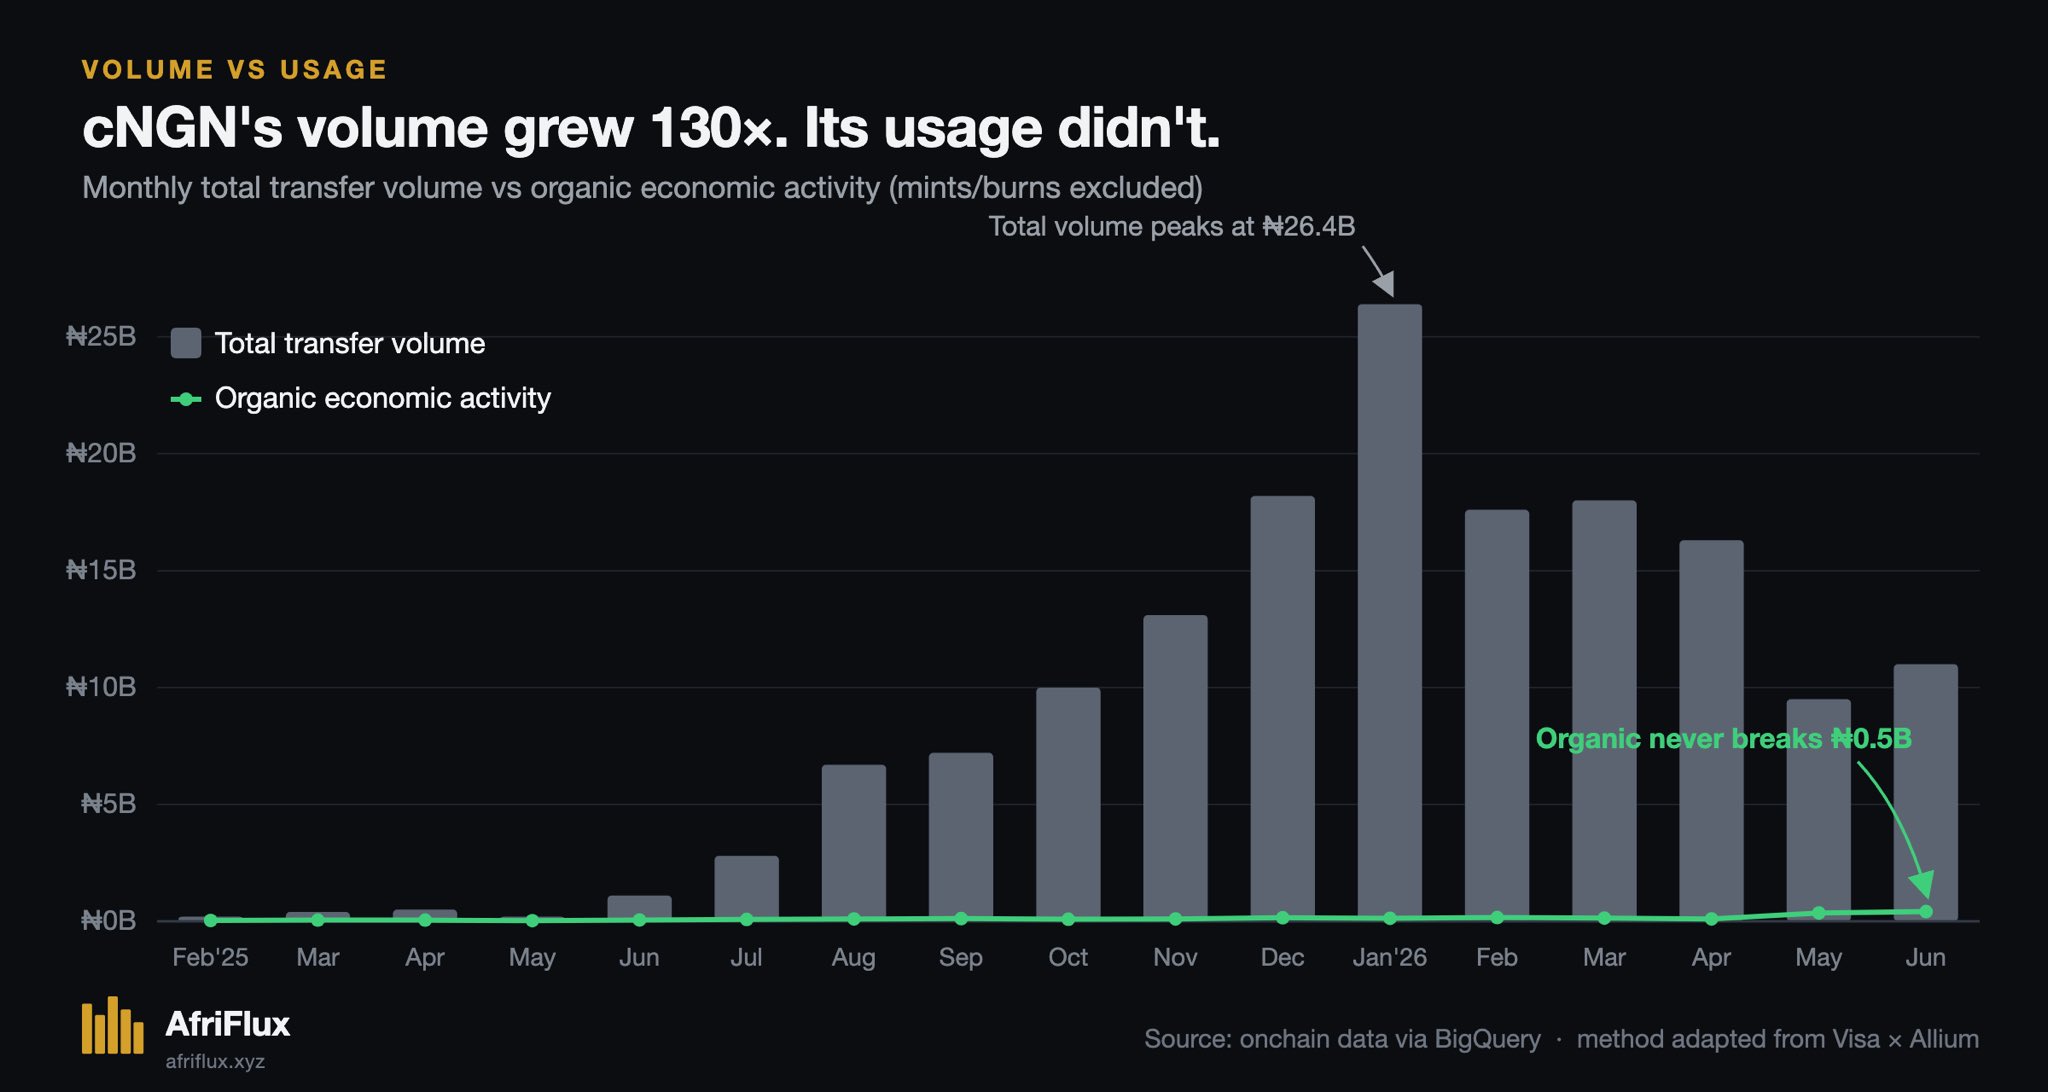
One genuinely encouraging signal: May and June 2026 posted the highest organic volumes in cNGN's history — ₦354M and ₦413M respectively. Still small in absolute terms, but the direction right now is up.
Who the real users are
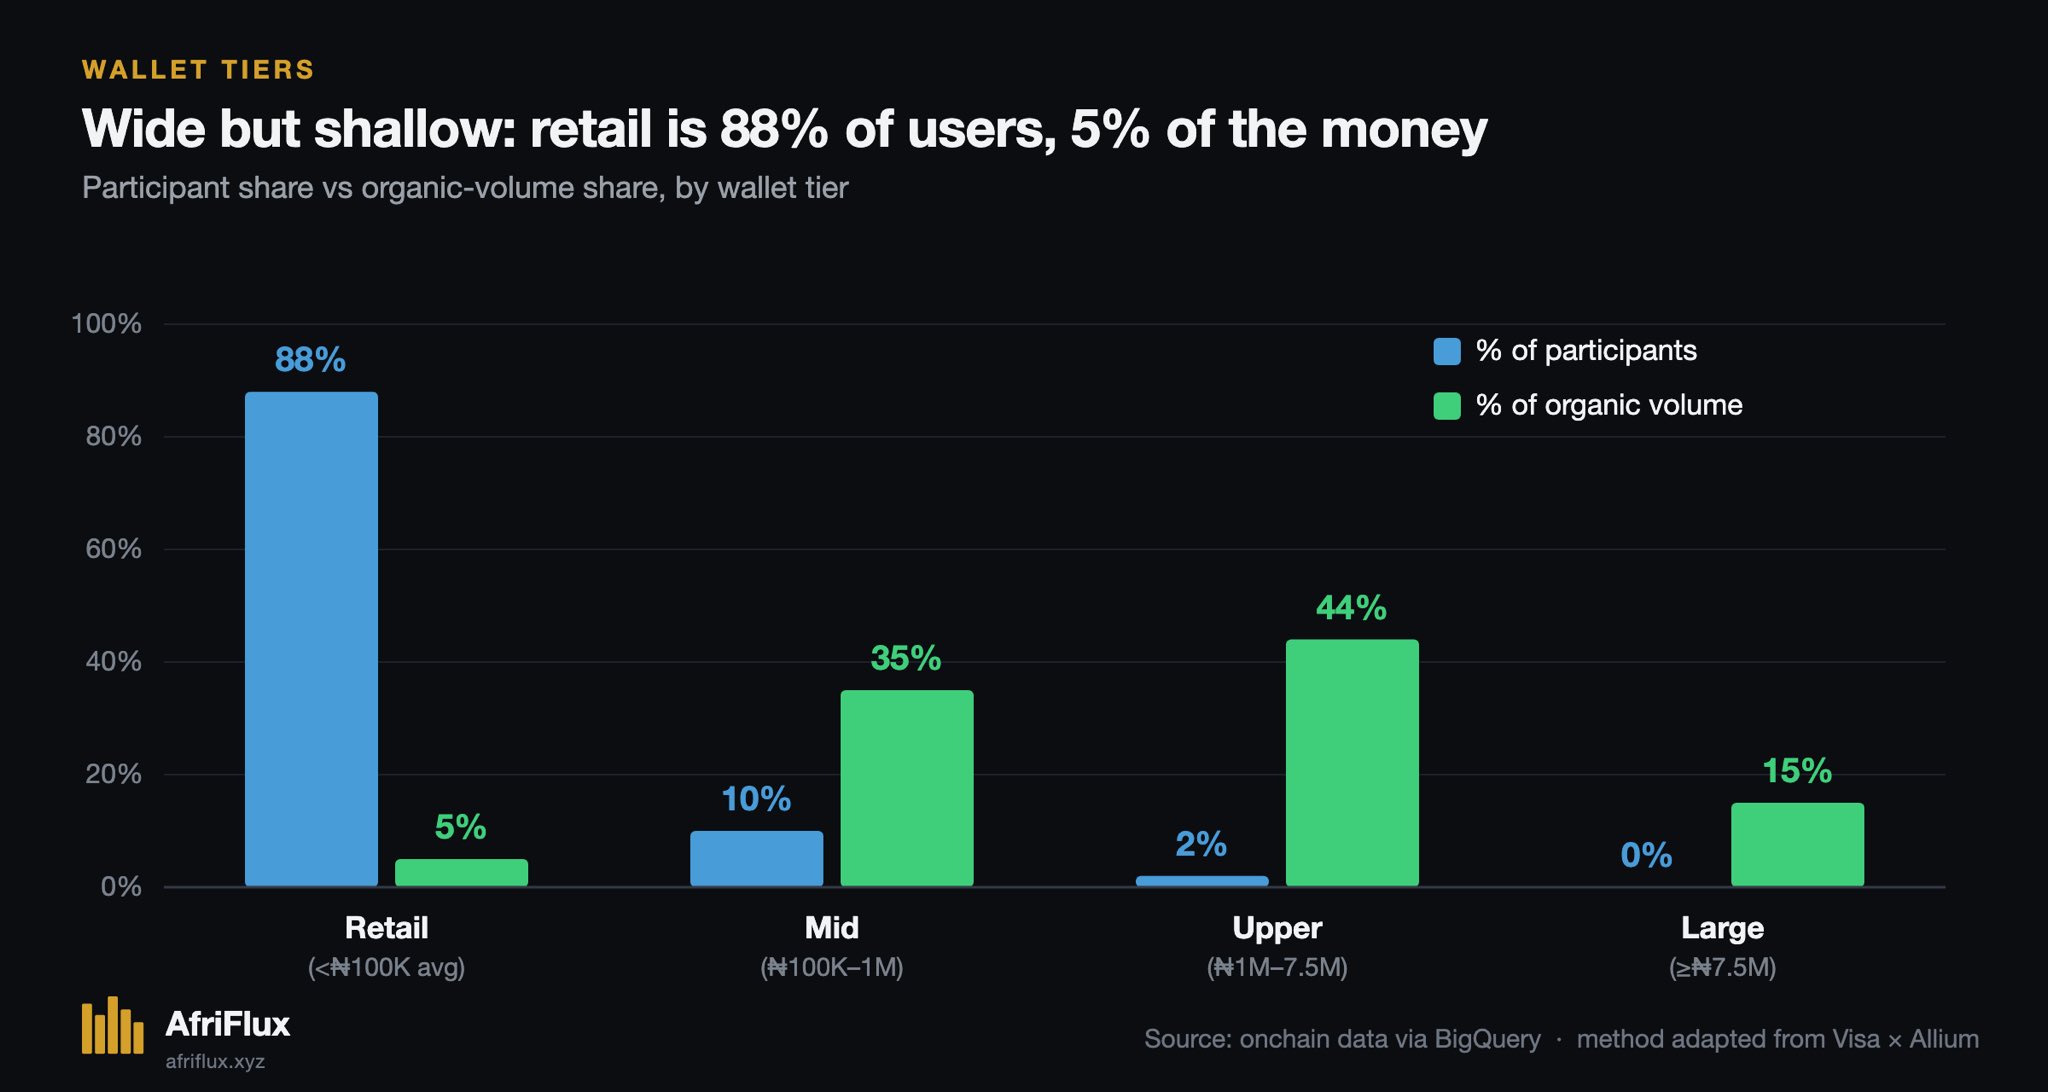
Zooming into the real 1.5% layer, around 5,900 addresses, it's a barbell. Retail wallets are 88% of participants but only 5% of the money, and most transact once and disappear. The real economic weight sits with around 700 mid- and upper-tier wallets that do 80% of the organic volume — and they keep coming back.
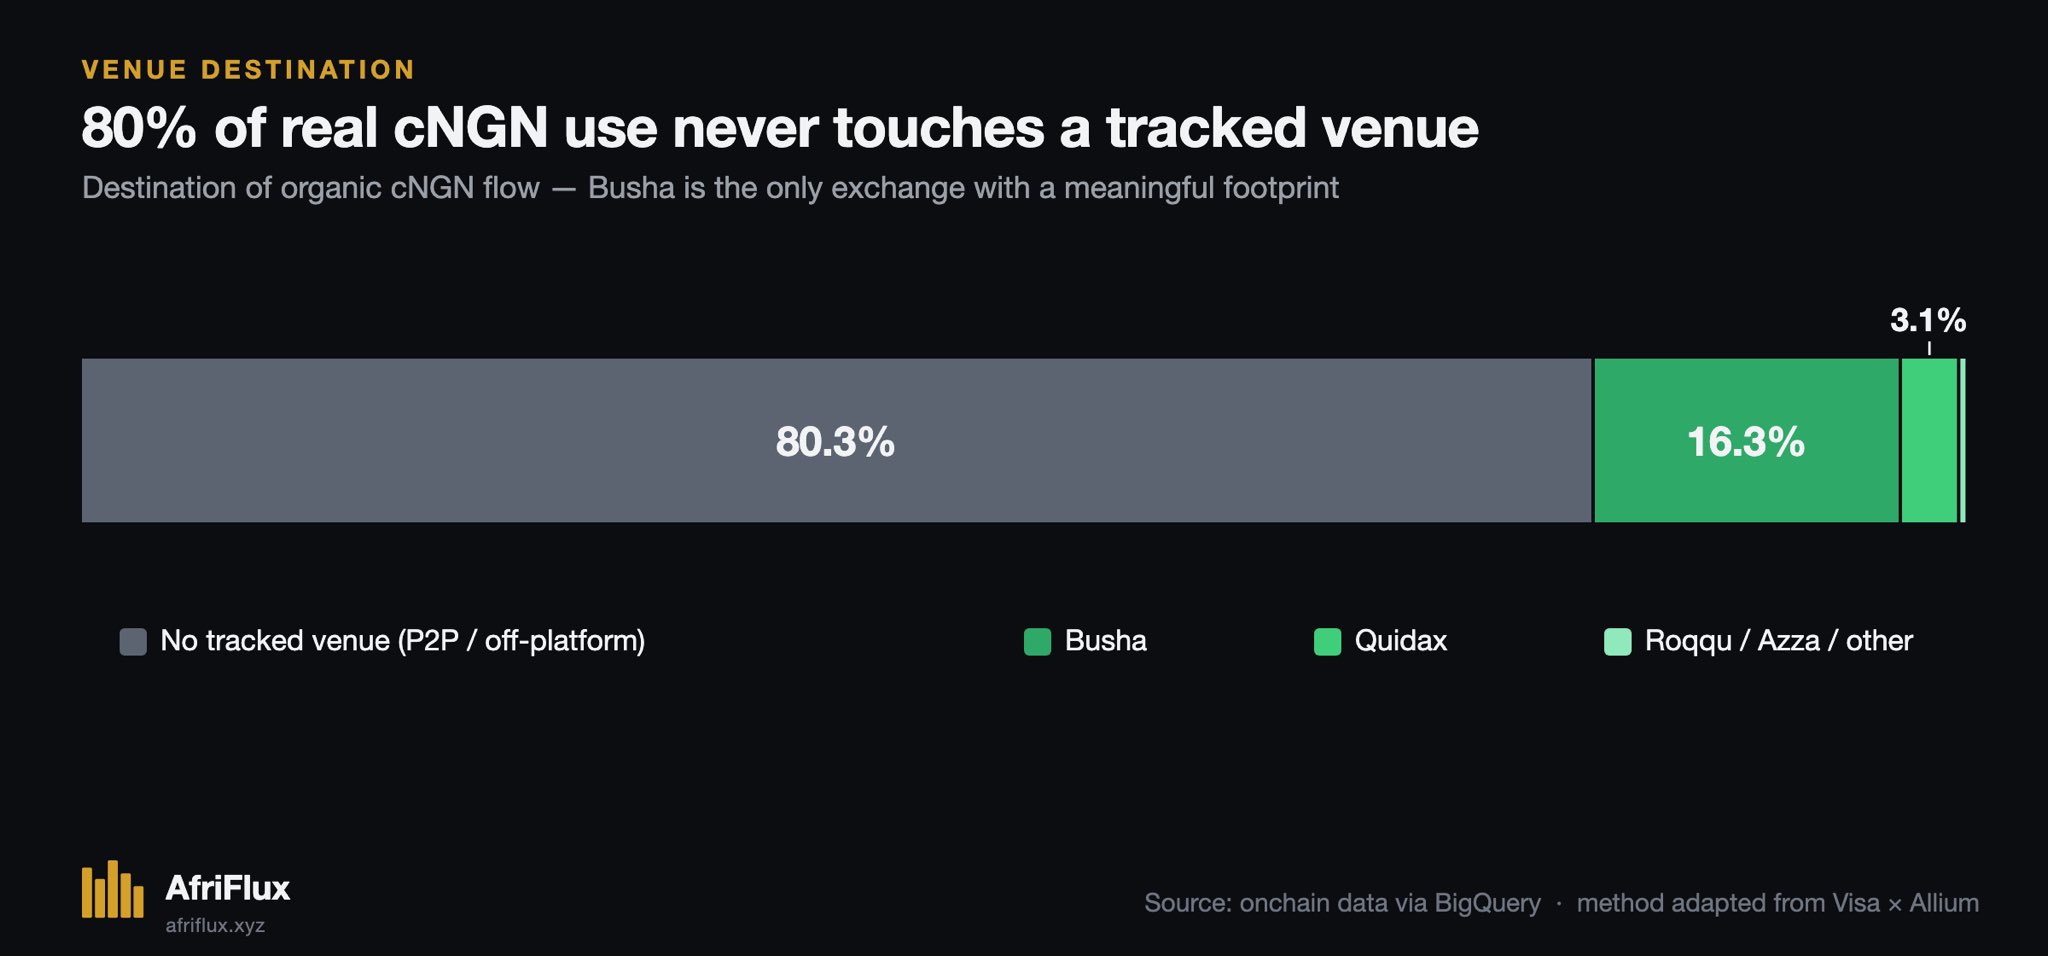
More than 80% of genuine organic cNGN activity happens off the tracked exchanges entirely, peer-to-peer or at other venues. Of what does touch tracked platforms, Busha leads, followed by Quidax. Very little of it lands in actual customer deposit addresses.
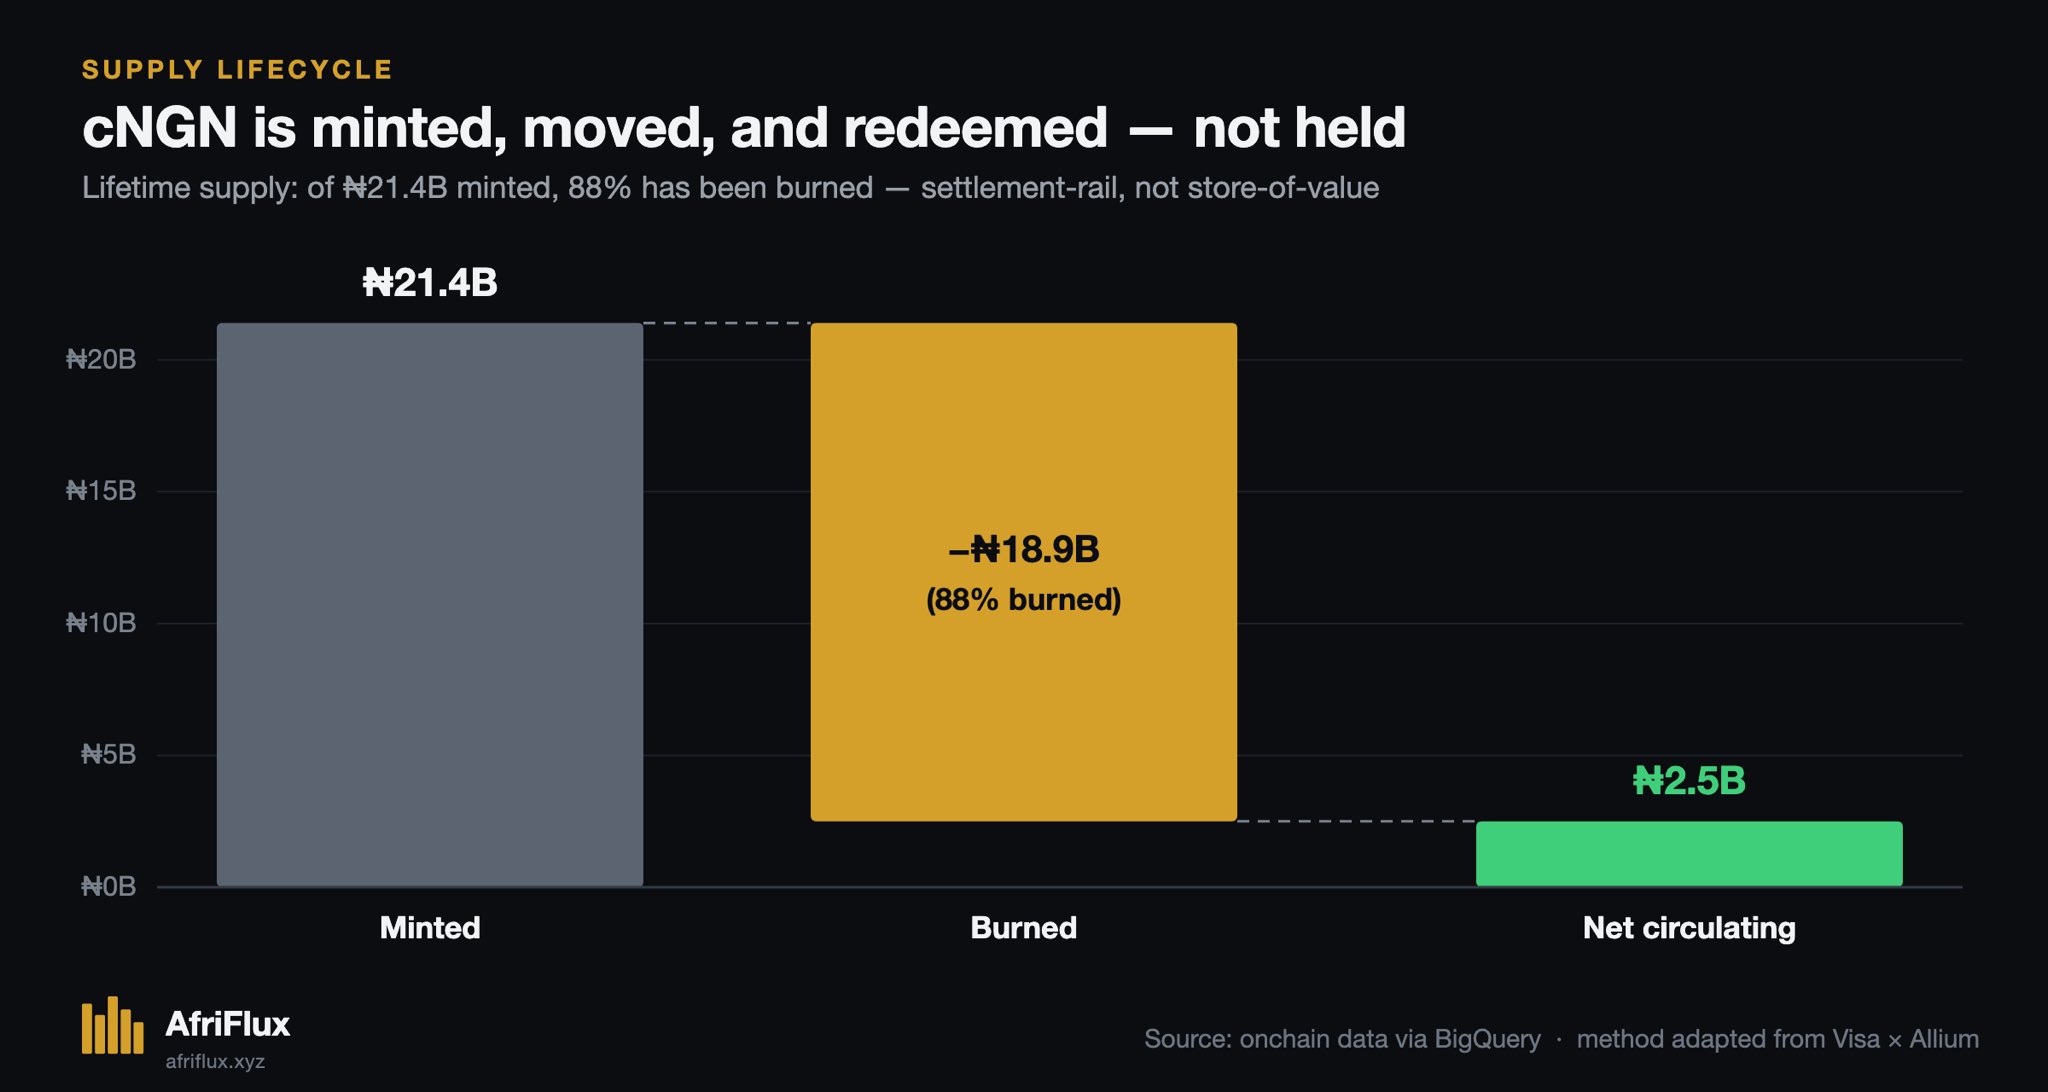
And cNGN is overwhelmingly a mint → move → redeem instrument. Of everything ever minted, 88% has already been burned; only around ₦2.5 billion remains in net circulating supply. It behaves like a settlement rail, not a currency people hold.
The honest reading
Not "cNGN is winning" or "cNGN failed."
It's this: cNGN has found a small, specific groove as a compliant settlement tool used by a modest set of recurring mid-sized actors — mostly off the main retail rails. Real retail usage remains early and thin.
Method
Every observed peer transfer of cNGN (₦160.6B) classified using an adaptation of the Visa × Allium stablecoin methodology, with thresholds calibrated to cNGN's scale and same-entity netting added from the BIS approach. Transfer volume only — mints and burns are excluded from the classified base and reported separately in the supply lifecycle. Classification separates issuer infrastructure, same-entity rotation, exchange and bridge churn from arms-length transfers between independent parties.
How attribution works →Cite this
Free to cite with attribution. No embargo, no approval needed.
AfriFlux (2026). 98.5% of cNGN's volume is infrastructure, not use. Published 6 July 2026. https://www.afriflux.xyz/feed/cngn-98-percent-infrastructure
Reproducing a chart? Use this line: Source: AfriFlux — on-chain intelligence for Africa's stablecoin economy. afriflux.xyz