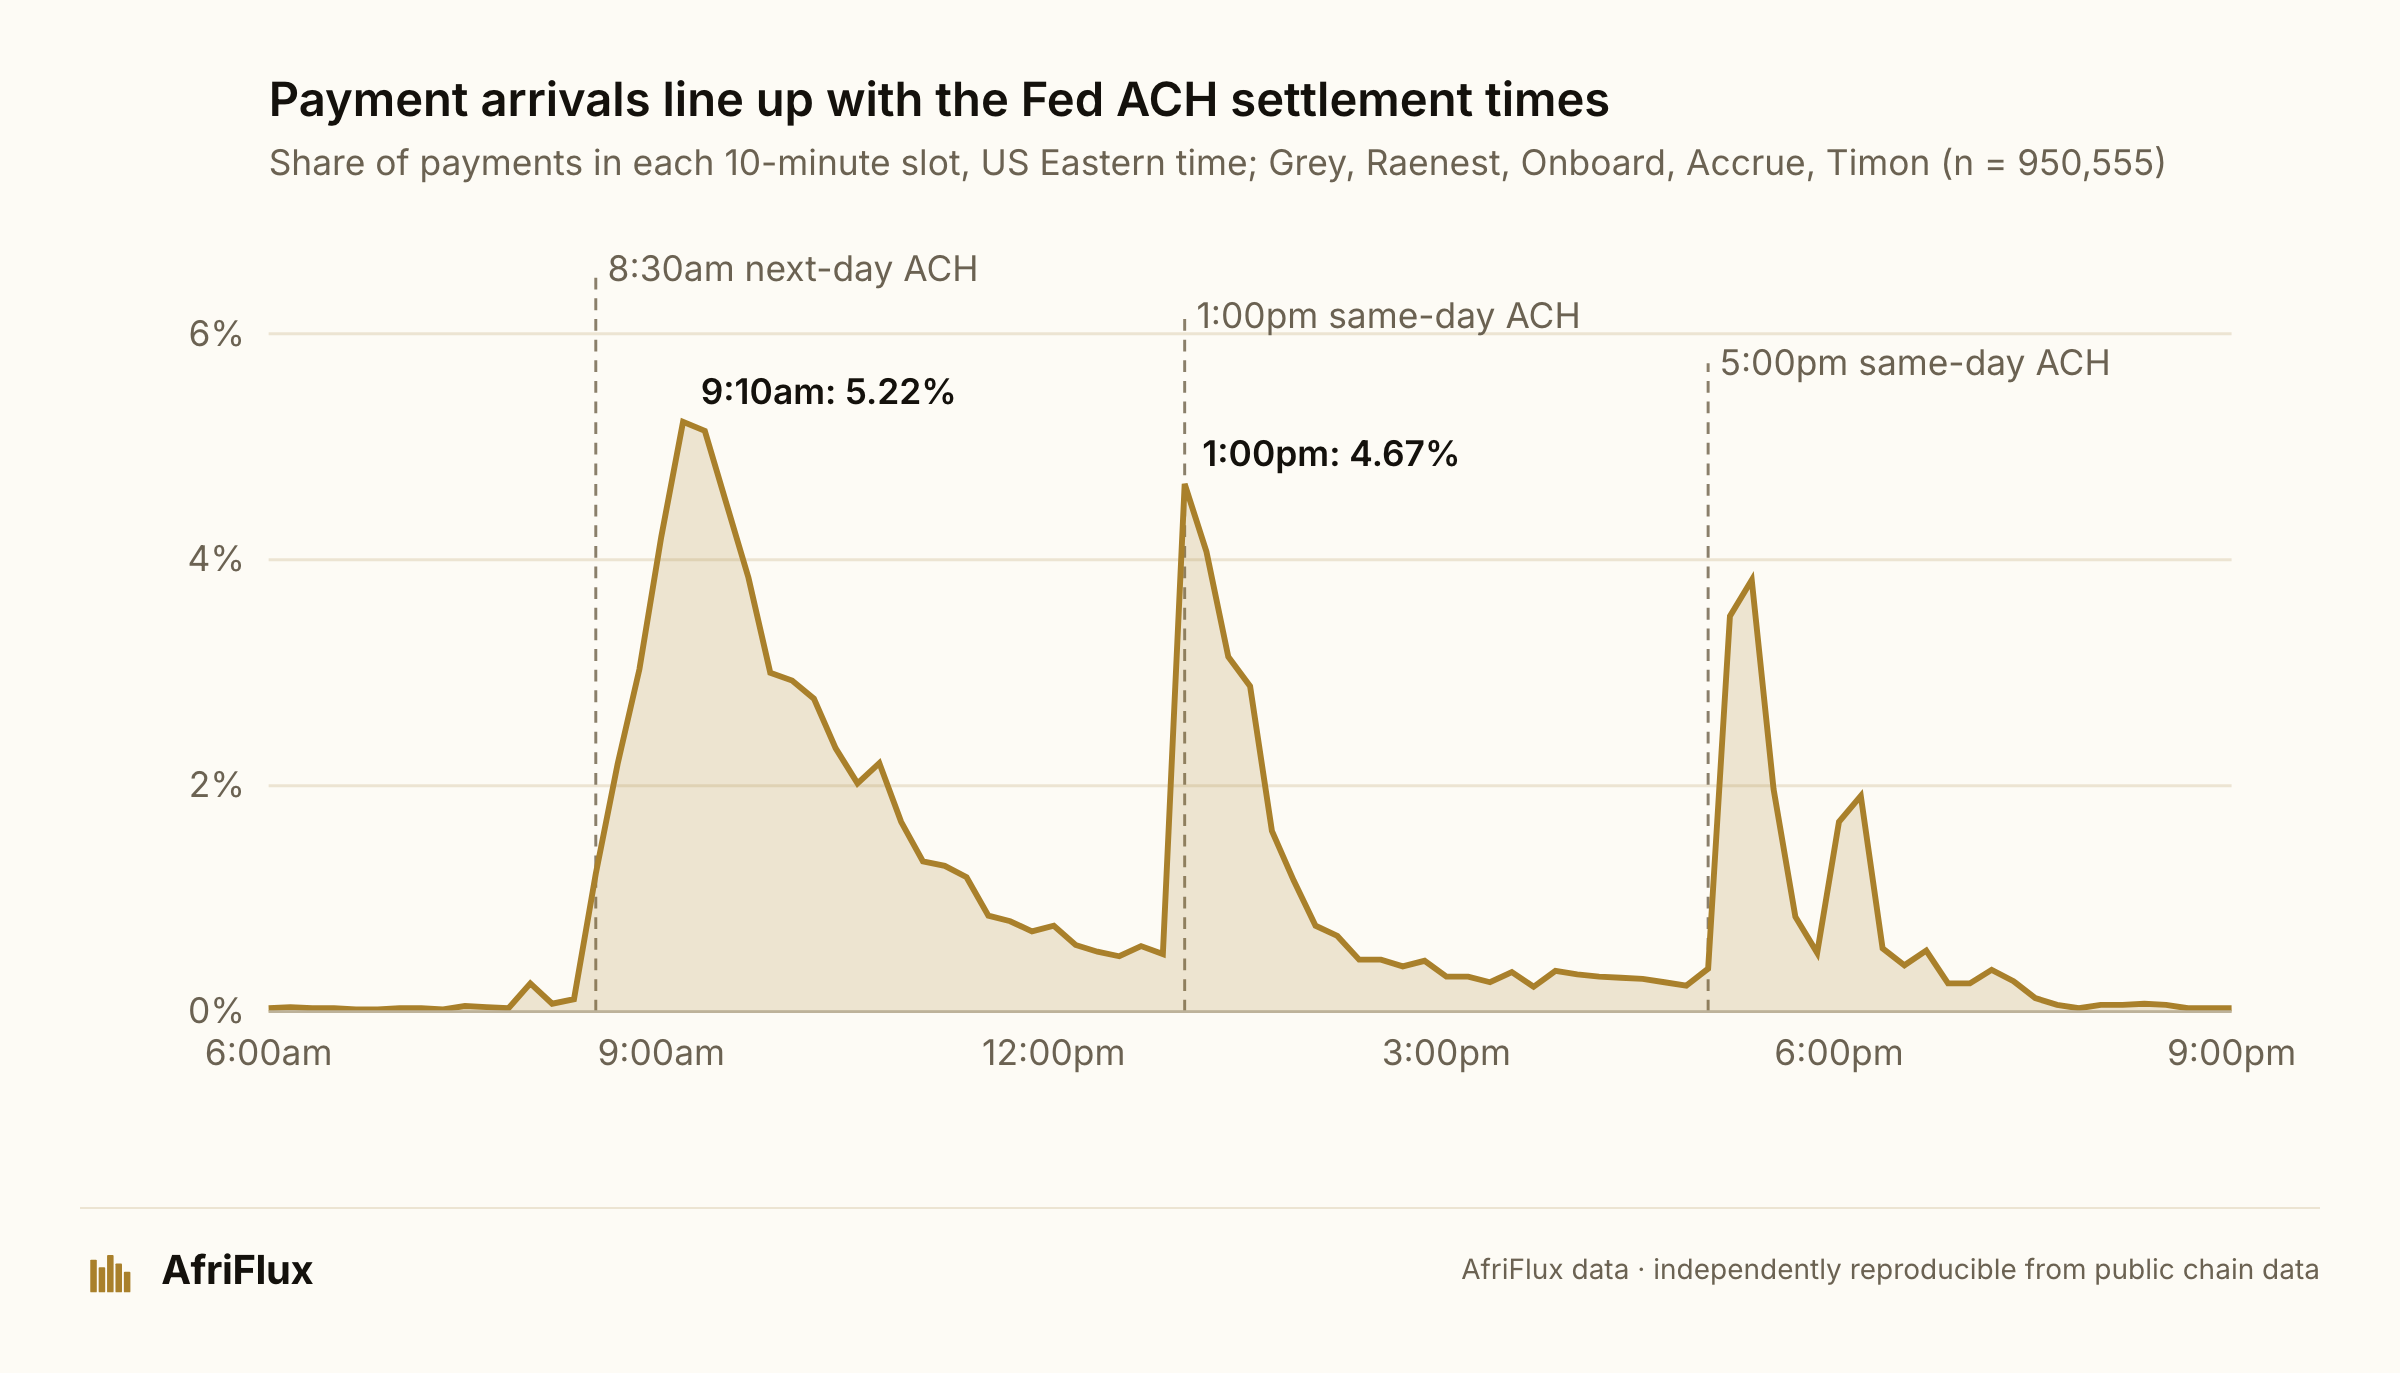
At 1:03pm Eastern on an ordinary weekday, a few minutes after the US Federal Reserve settles its same-day ACH batch, the dollar accounts of six Nigerian neobanks fill up. That timing aligns with the Fed's ACH settlement schedule. Timing is evidence, not proof: the chain does not show which US rail carried any single payment.
On Juneteenth, Columbus Day and Veterans Day, holidays nowhere in Nigeria, almost nothing arrives. On Eid, Easter and Democracy Day the flow barely moves, and the naira doesn't steer it either. The money landing in these accounts runs on America's clock and calendar, not Nigeria's. Where individual addresses can be followed, it looks like regular but variable income: it recurs, but rarely in a steady, salary-like amount.
That timing is the way into a bigger question: what does the money arriving in Nigeria's virtual dollar accounts tell us about the people earning it, the platforms paying them, and the infrastructure moving it?
What we measured
Virtual-account volume, as used here, is the stablecoin that Bridge pays into receiving addresses AfriFlux maps to six neobanks whose primary market is Nigeria: Grey Finance, Raenest, Chipper, Onboard, Accrue and Timon. It is the part of those neobanks' dollar-account activity that can be observed onchain. It is not their total dollar-account volume, nor the size of Nigeria's dollar-account market: it excludes their other banking partners, fiat that never becomes stablecoin, and anything settled off chain. All six serve Nigeria first, and some serve other African countries too; onchain we cannot see where a recipient lives, so "Nigerian" here describes the neobanks' home market, not each recipient.
Research timeline. The data runs from the first settlement on 7 October 2023 to 10 November 2026, frozen at block times before midnight US Eastern on 11 November 2026. The analysis was carried out between 11 and 12 November 2026, and every figure and chart in this piece is drawn from that one frozen file.
We followed $402.02M across 1,063,155 settlements in that window. Throughout, a payment is one settlement leg, not one person. The 1,063,155 legs went to far fewer people, and for most of the value we cannot tell those people apart, because the neobank receives into a shared company wallet.
| Measure | Value |
|---|---|
| Settlements (payment legs, not people) | 1,063,155 |
| Total value | $402.02M |
| Period | 7 October 2023 – 10 November 2026 |
| Data cut-off | Block times before midnight US Eastern on 11 November 2026 |
| Median payment | $83.87 |
| Share of value in payments of $1,000 or more | 63.9% (9.7% of payments) |
| Busiest minutes on the rail | 1:03–1:05pm Eastern, minutes after the Fed's 1:00pm ACH settlement |
| Payments landing in the ACH windows | 74.3% excluding Chipper, against 42.2% for Bridge's other payouts |
| Payments on Saturdays and Sundays | 0.2% (Grey) |
| Change on US bank holidays | −99.2% |
| Change on Eid, Easter and Nigerian public holidays | roughly flat |
| Per-user addresses meeting a strict salaried rule | 1.1% of 1,139 analysed Onboard addresses |
| Share of Grey's dollars arriving by US bank transfer | 79% |
The rest of the piece shows each of these, then two things the pattern exposed: a recurring €1,500-equivalent payment pattern in mid-2025, and a monthly batch of about 10,000 small payments that reaches Grey on the 29th.
Limits, in brief. This measures Bridge-attributed flows into six neobanks, not all their dollar-account activity, so every total is a floor. Where a neobank receives into a pooled company wallet we can analyse payments but cannot reliably identify individual earners; earner findings rest on the per-user addresses, mostly Onboard's and Chipper's. Onchain data does not reveal the original payer or the purpose of a payment: every reading of who or why is an inference from amounts and timing. The full method is at the end.
On US banking time
The sharpest pattern in the data is when the money arrives. Across the neobanks fed by US bank transfers, 74.3% of payments and 75.7% of their value land in the hour or two after a US Federal Reserve ACH settlement, a timing that aligns with ACH, the batch system American payroll and payout platforms use. The three busiest minutes on the whole rail are 1:03, 1:04 and 1:05pm Eastern, three to five minutes after the Fed's 1:00pm same-day settlement. The chart at the top of this page shows it in ten-minute slots.
The morning wave builds from 8:40, ten minutes after the 8:30 next-day settlement, and peaks around 9:10–9:30. The 5:10–5:30pm wave is smaller in count but carries the biggest payments: $44.0M has landed in those twenty minutes. Midnight to 8am Eastern carries 1.2% of payments. In Lagos, this money arrives between about 2pm and 11pm.
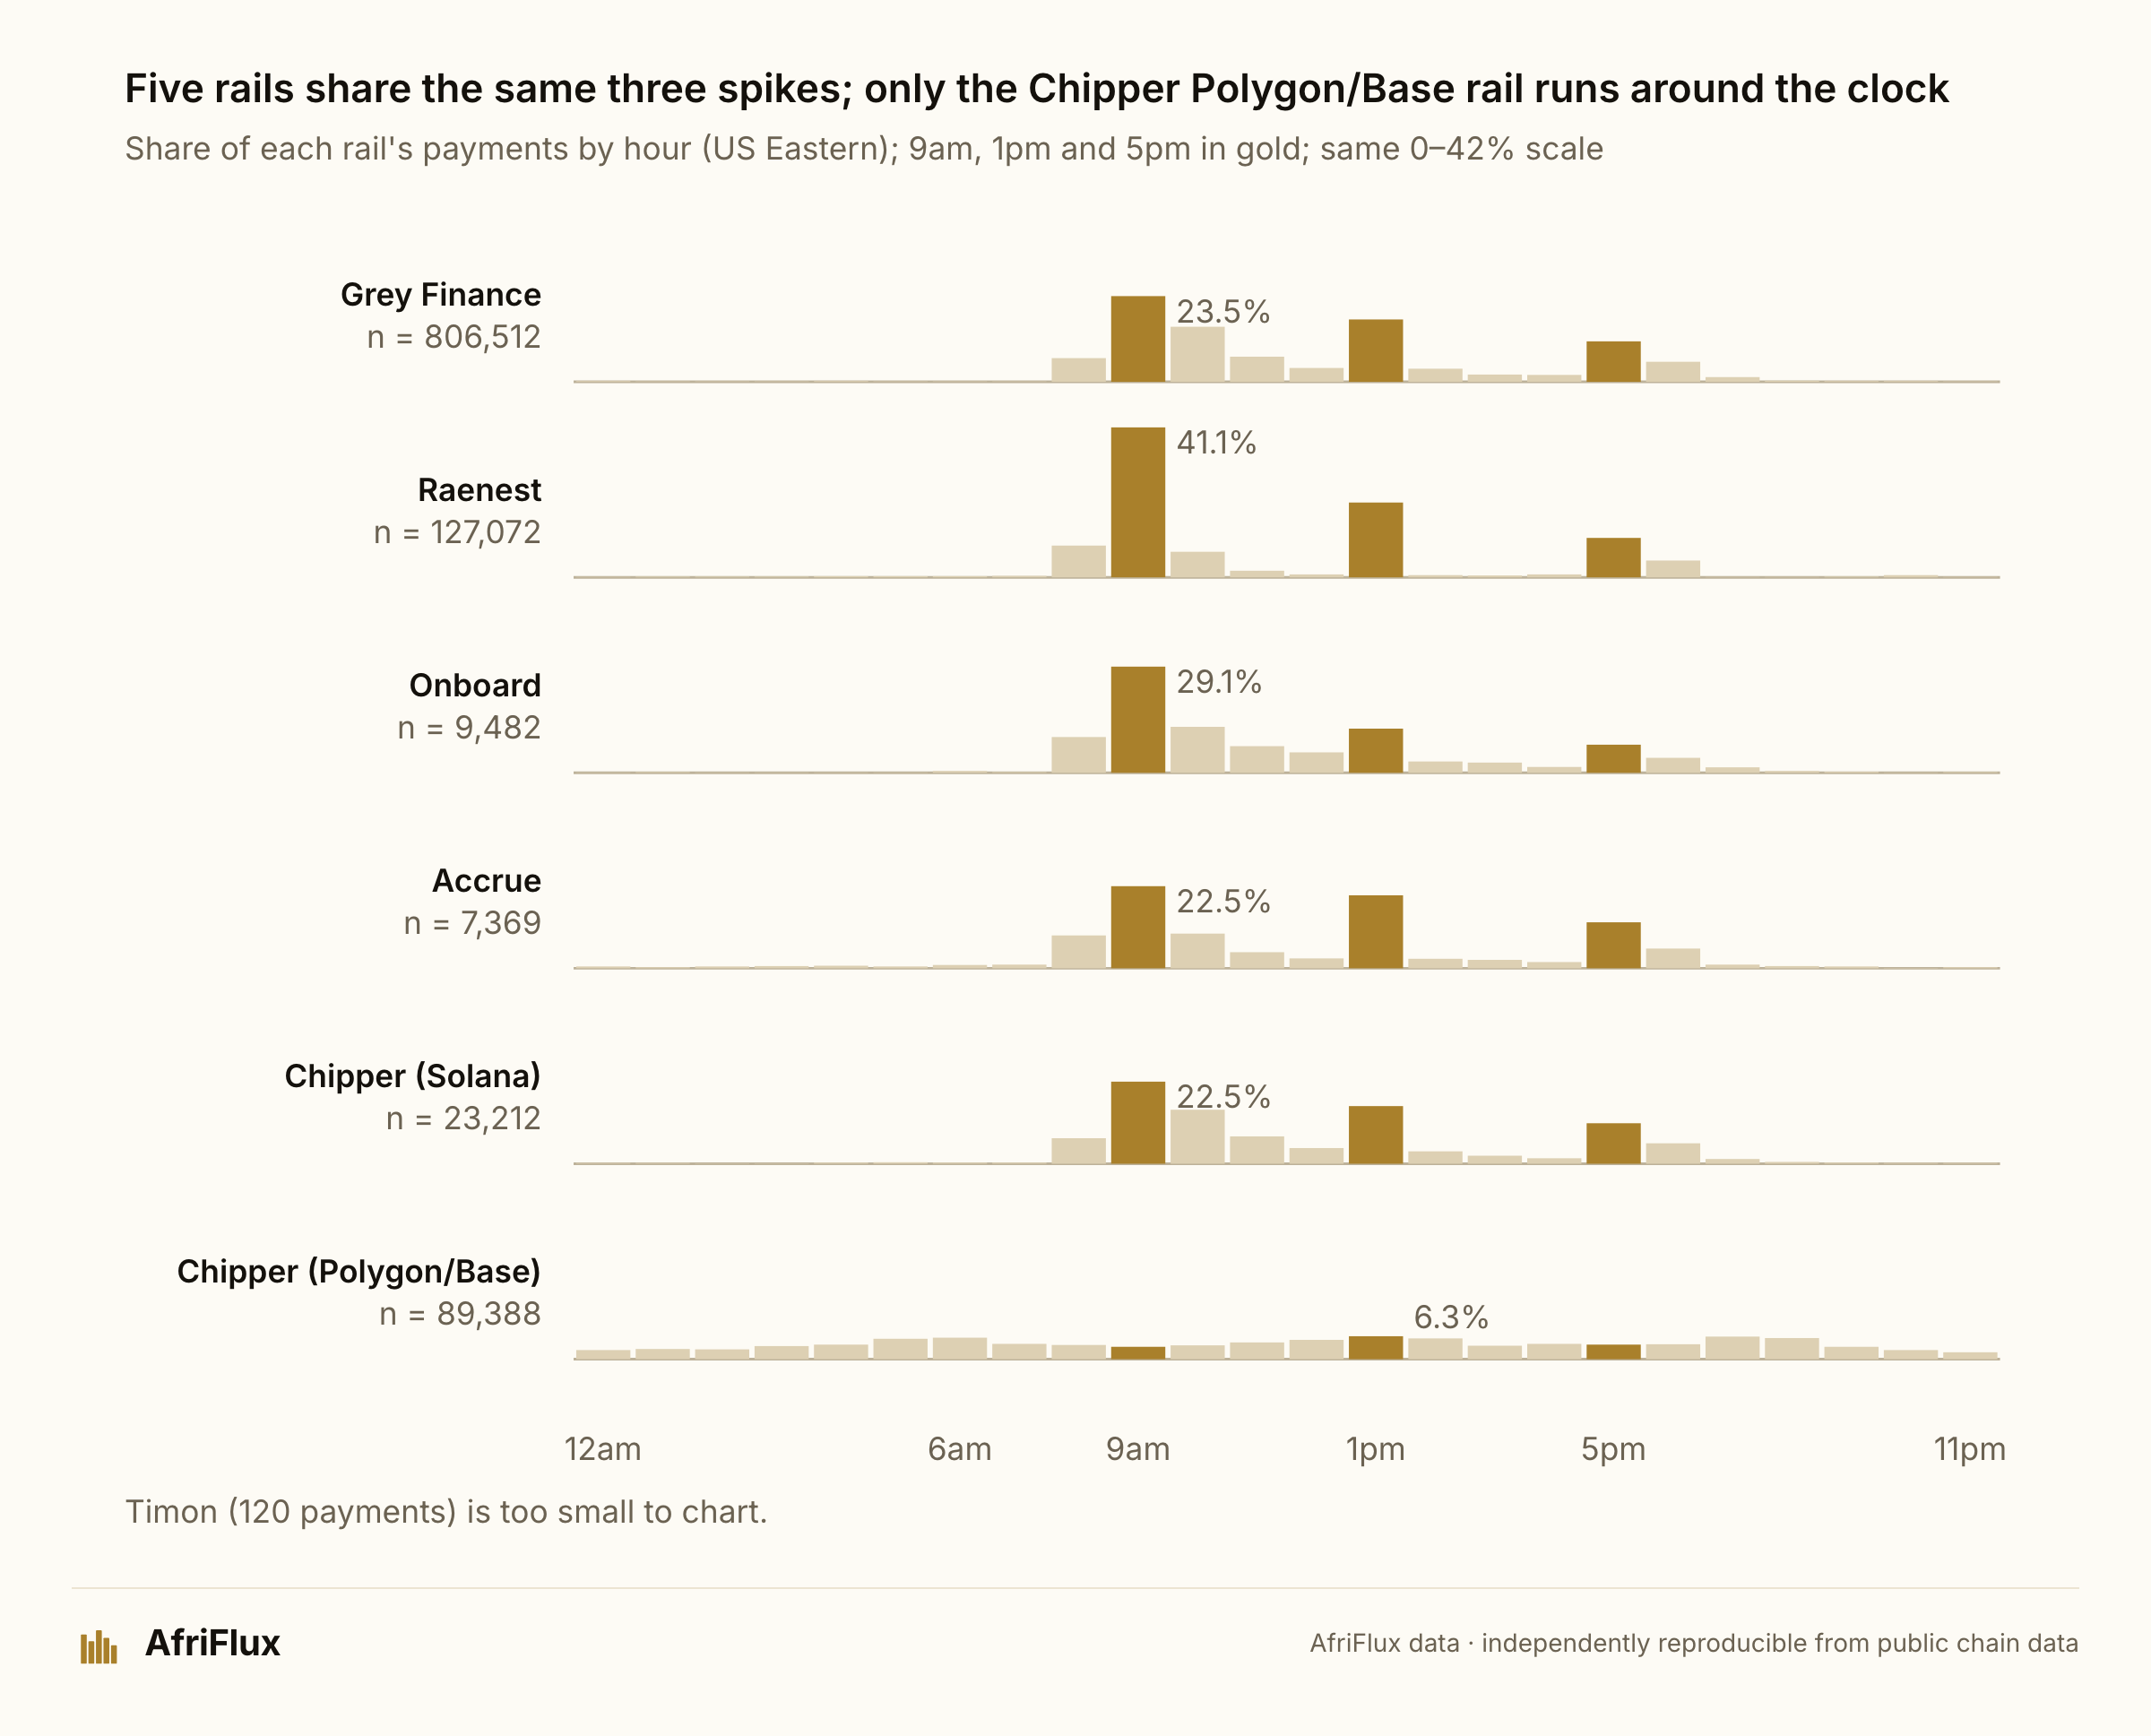
Grey, Raenest, Onboard and Accrue show the same three spikes; Raenest is the most concentrated, with 41.1% of its payments in the 9am hour. Chipper is the exception, and the split is by chain: Chipper's Solana flow lands in the ACH windows like the others (68.8%), while its Polygon and Base flows do not (21–26%, with over a quarter at weekends). Chipper is treated separately where that matters.
Three checks stand behind the timing claim:
- A control. Bridge's other payouts over the same period, 11.2 million transfers worth $23.77bn to addresses outside these six neobanks, show faint versions of the same bumps but are far flatter: 42.2% in the ACH windows, 16.1% at weekends, 16.0% between midnight and 8am Eastern. The six neobanks' flow is 74.3%, 0.21% and 1.2%.
- Daylight saving. Week by week, the afternoon wave's median holds at about 1:20–1:45pm Eastern either side of each clock change, rather than jumping an hour as a UTC-scheduled process would. What did change is speed: through early 2026 the afternoon wave arrived around 1:30pm, and by mid-2026 at 1:03–1:05pm.
- Outside the windows. The quarter of payments that land outside them (25.7%, excluding Chipper) is mostly the tail of each burst, between 10am and noon and 2 and 4pm Eastern; only 0.7% of it falls at weekends. It is not evidence of a separate wire or instant-payment rail.
The calendar: weekends, US holidays and the naira
If the money is US bank money, it should keep US banking days. It does. On the bank-fed neobanks, Saturday and Sunday each carry 0.1% of payments: 0.2% of Grey's, 0.4% of Raenest's, 0.3% of Onboard's. The weekend's money is not lost; it waits, and Monday clears it.
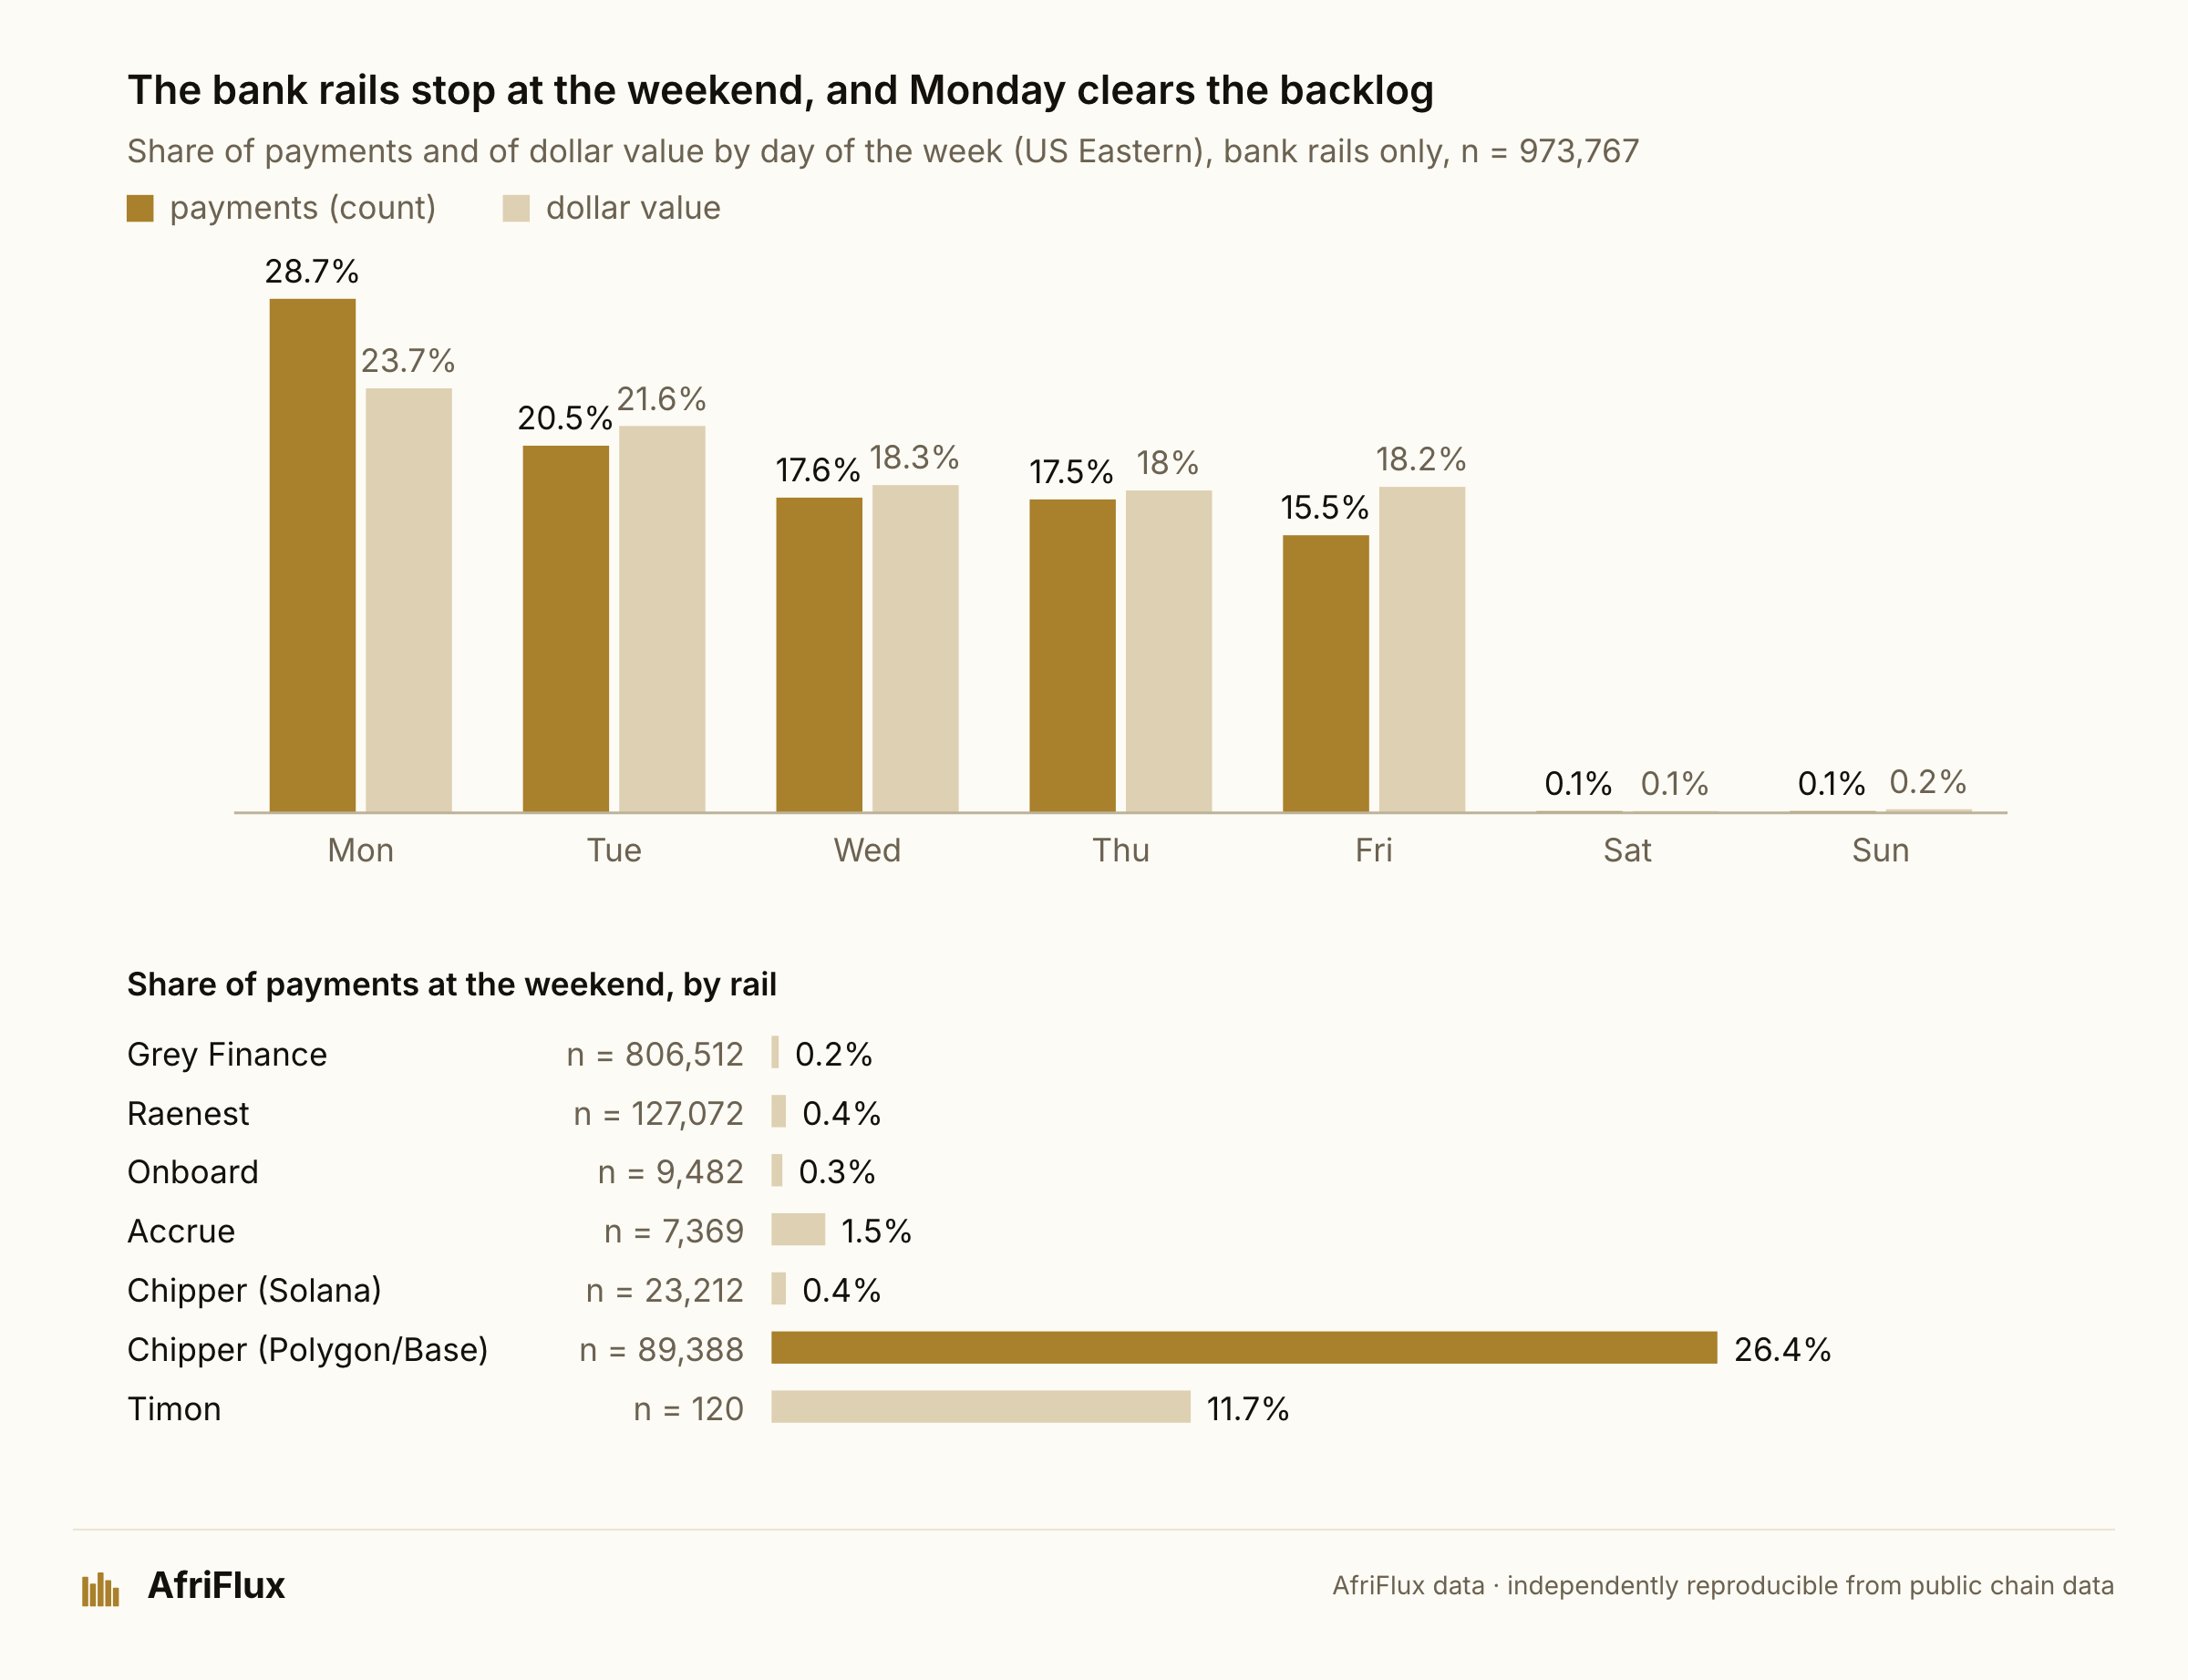
The holiday test is sharper still. On the 17 US Federal Reserve holidays with full data, the rail recorded 297 payments against about 36,600 on comparable days: down 99.2%, and every one fell 97–100%. On Independence Day 2025 it recorded none. The next business day runs 24.7% above normal as the held money clears. On Veterans Day this week, 11 November 2026, the rail logged 92 payments against 2,596 the Wednesday before.
The mirror test matters as much. Good Friday, Easter Monday, both Eids and Nigeria's Democracy Day are not US holidays, and on them the money barely moves.
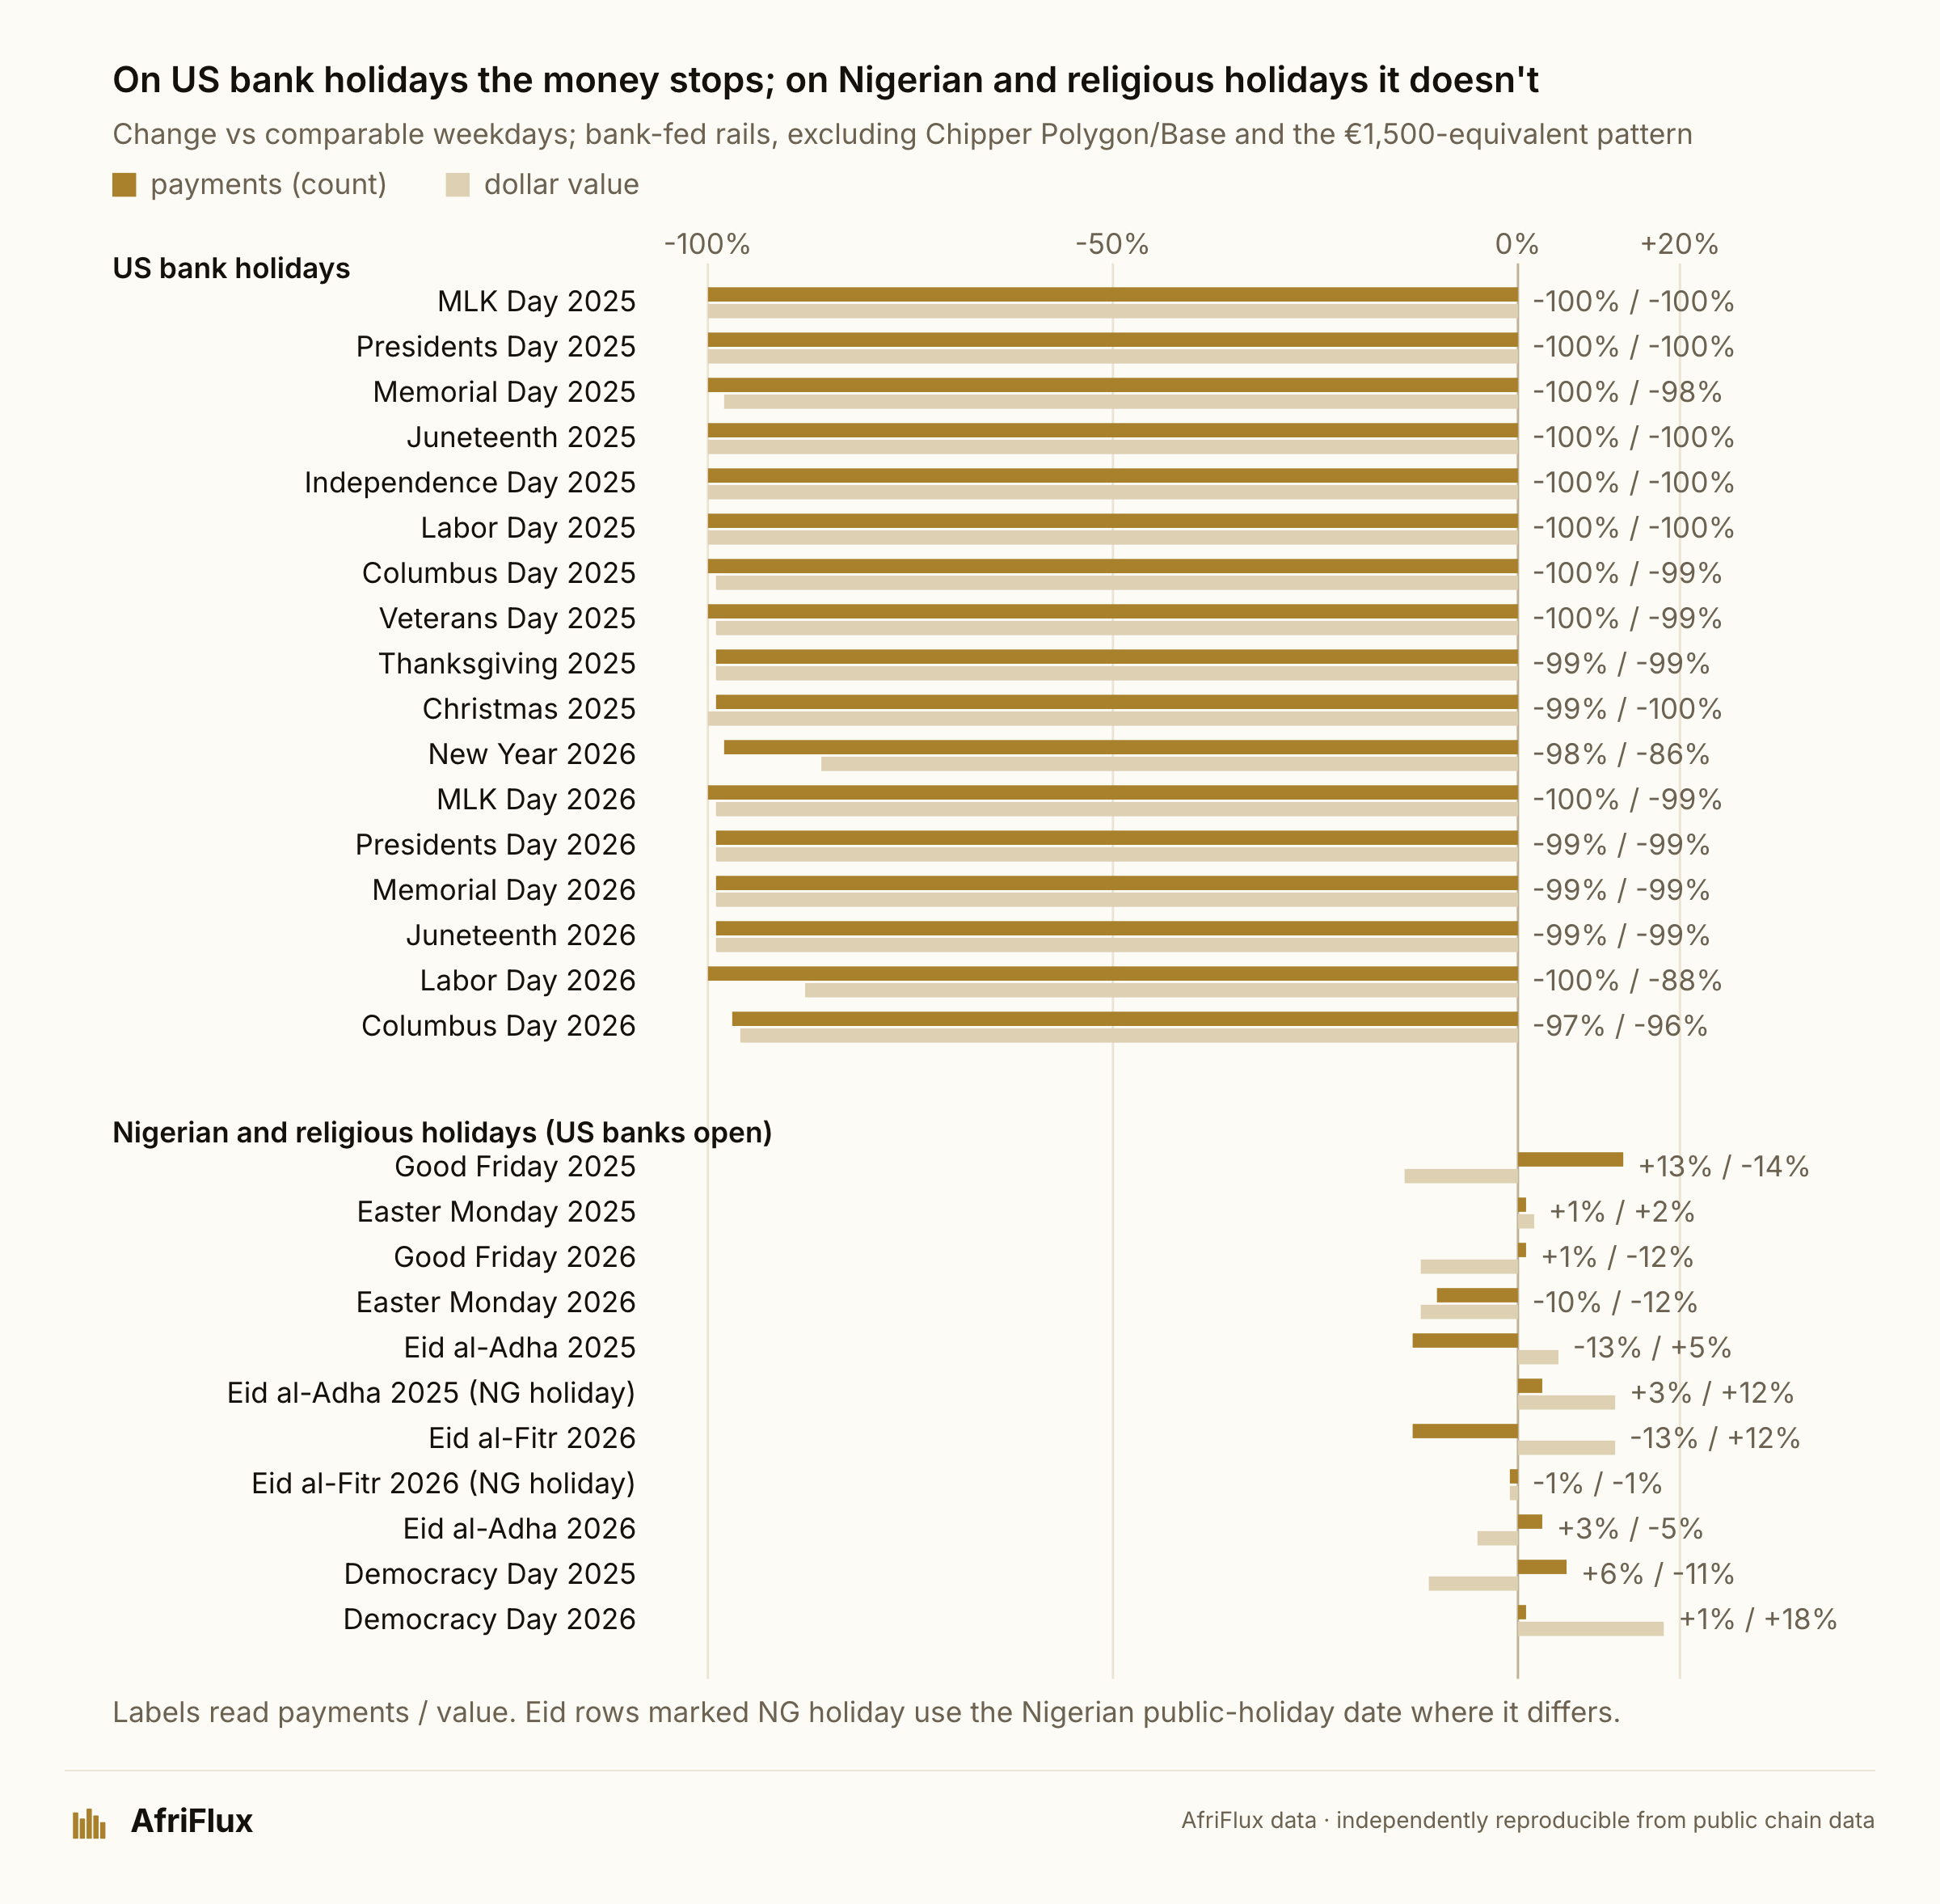
Juneteenth, Columbus Day and Veterans Day are holidays nowhere in Nigeria, yet they switch this money off; Eid does not. The one signal from the recipients' side is the last week of Ramadan, when Grey's inflow ran 26% (2025) and 15% (2026) below the weeks around it. Boxing Day's jump is the US Christmas backlog clearing, not a Nigerian effect.
The US holiday effect holds at every neobank, in both count and value (€1,500-equivalent pattern excluded; including it, Grey's value change is −96.8%):
| Neobank (rail) | Payments on US holidays vs normal | Value vs normal | Weekend share of payments |
|---|---|---|---|
| Grey Finance | −99.3% | −96.2% | 0.2% |
| Raenest | −98.7% | −97.9% | 0.4% |
| Onboard | −98.1% | −97.8% | 0.3% |
| Accrue | −96.1% | −98.8% | 1.5% |
| Chipper (Solana) | −98.0% | −94.6% | 0.4% |
| Chipper (Polygon and Base) | +13.1% | −62.0% | 26.4% |
Chipper's Polygon and Base flow keeps running on US holidays and at weekends: it is a different rail from the US-bank-fed flow. On Nigerian public and religious holidays, Grey stays within about 15% of normal in both count and value; Onboard and Accrue swing by up to 50% either way, which is noise from their small daily volumes, not a holiday effect. Workers' Day and Nigerian Independence Day fall on the first business day of the month, a payday, so they are left out of the holiday comparison.
Nor does the naira steer it. Week by week, inflow growth and the naira's move are unrelated at Grey (correlation +0.03 over 92 weeks), Raenest (−0.13), Chipper (−0.13) and Onboard (+0.08). Only Accrue's inflow rises the week after the naira weakens (+0.40), on small volumes. Over the whole period the two moved in opposite directions:
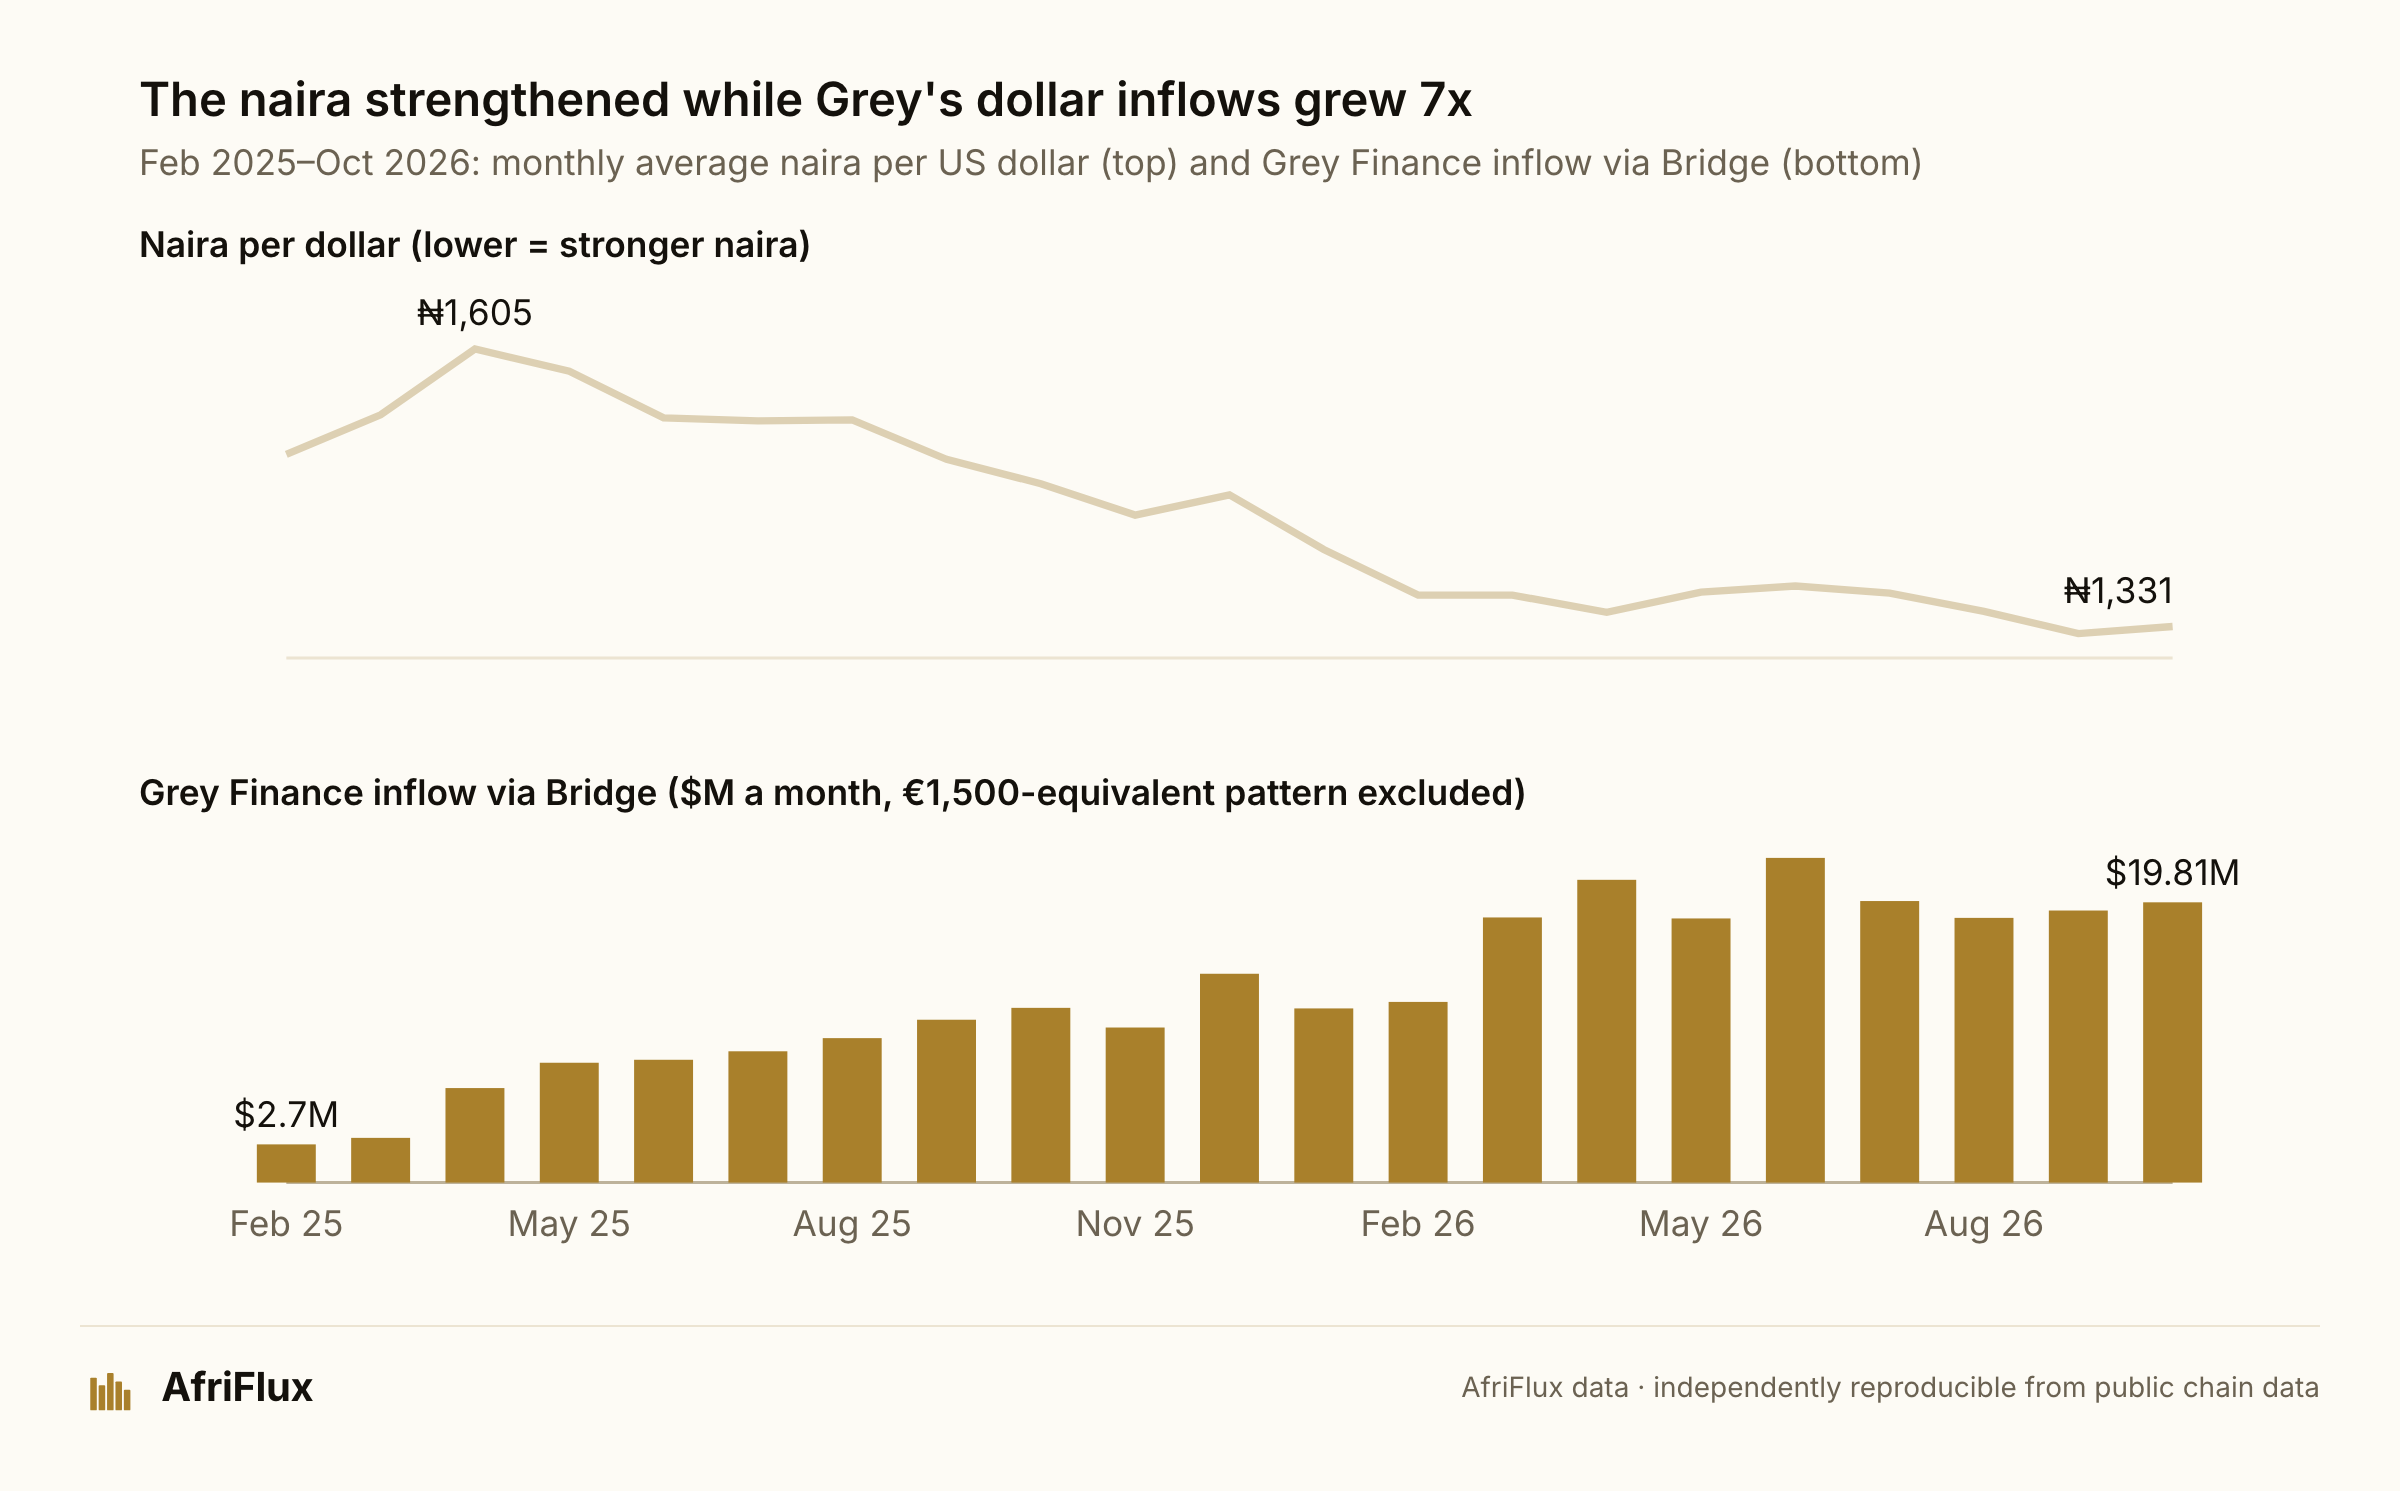
The naira strengthened from a peak of ₦1,605 per dollar in April 2025 to ₦1,331 in October 2026, while Grey's monthly inflow rose from $2.7M to $19.8M. The amount that arrives is set by the people paying, on their calendar, not by the exchange rate at the other end.
Takeaway: settlement schedules follow US banking operations far more closely than the recipients' local calendar. That is strong evidence of a link to US bank rails; it does not mean every payment is an ACH transfer.
What a payment looks like
Two kinds of payment share one rail. Most are small (the median is $83.87, and 53.4% are under $100) but the money sits in a minority of large ones.
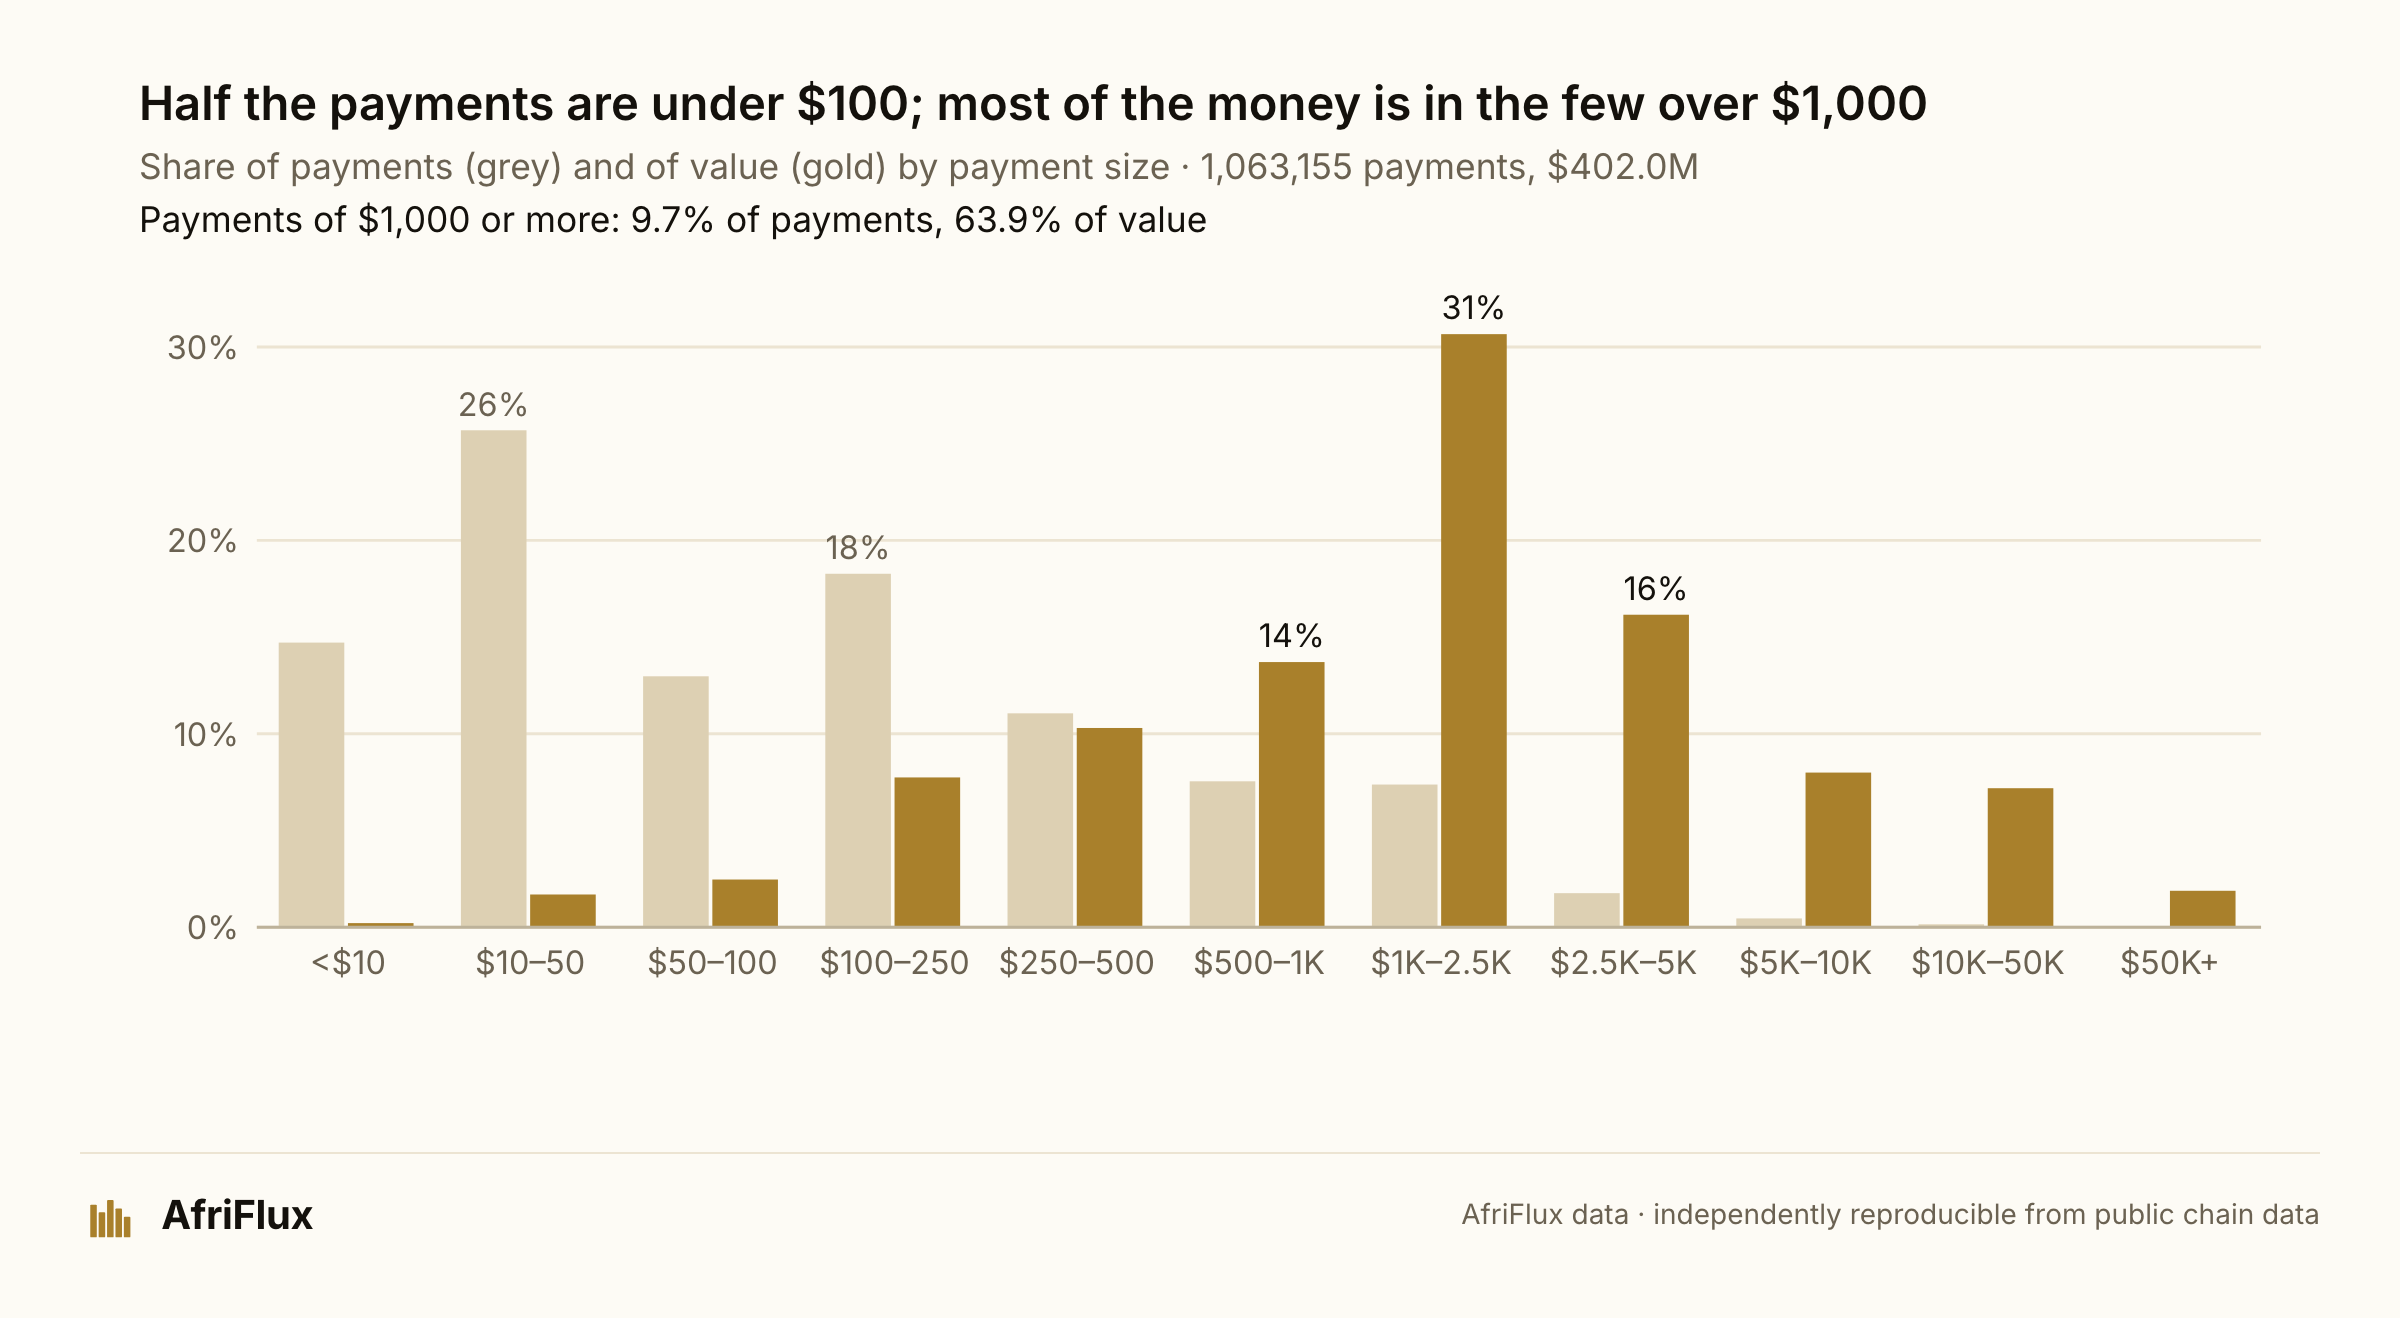
The single biggest band by value is $1,000–$2,500: 7.4% of payments, 30.7% of the dollars, the range where a month's pay or an invoice sits. The profile differs by neobank:
| Neobank | Payments | Median payment | 90th percentile | Value in payments of $1,000 or more |
|---|---|---|---|---|
| Onboard | 9,482 | $352 | $1,854 | 69.2% |
| Accrue | 7,369 | $255 | $1,760 | 73.4% |
| Raenest | 127,072 | $150 | $855 | 49.9% |
| Grey Finance | 806,512 | $95 | $1,052 | 66.1% |
| Chipper | 112,600 | $13 | $135 | 50.4% |
| Timon (too few to read) | 120 | $97 | $1,796 | 94.9% |
| All six | 1,063,155 | $83.87 | $980 | 63.9% |
The amounts are also far rounder than chance. 36.8% of payments are an exact whole-dollar amount where evenly spread cents would give about 1%; multiples of $100 alone carry 20.6% of all value. Roundness is suggestive of invoices and agreed fees, not proof of them.
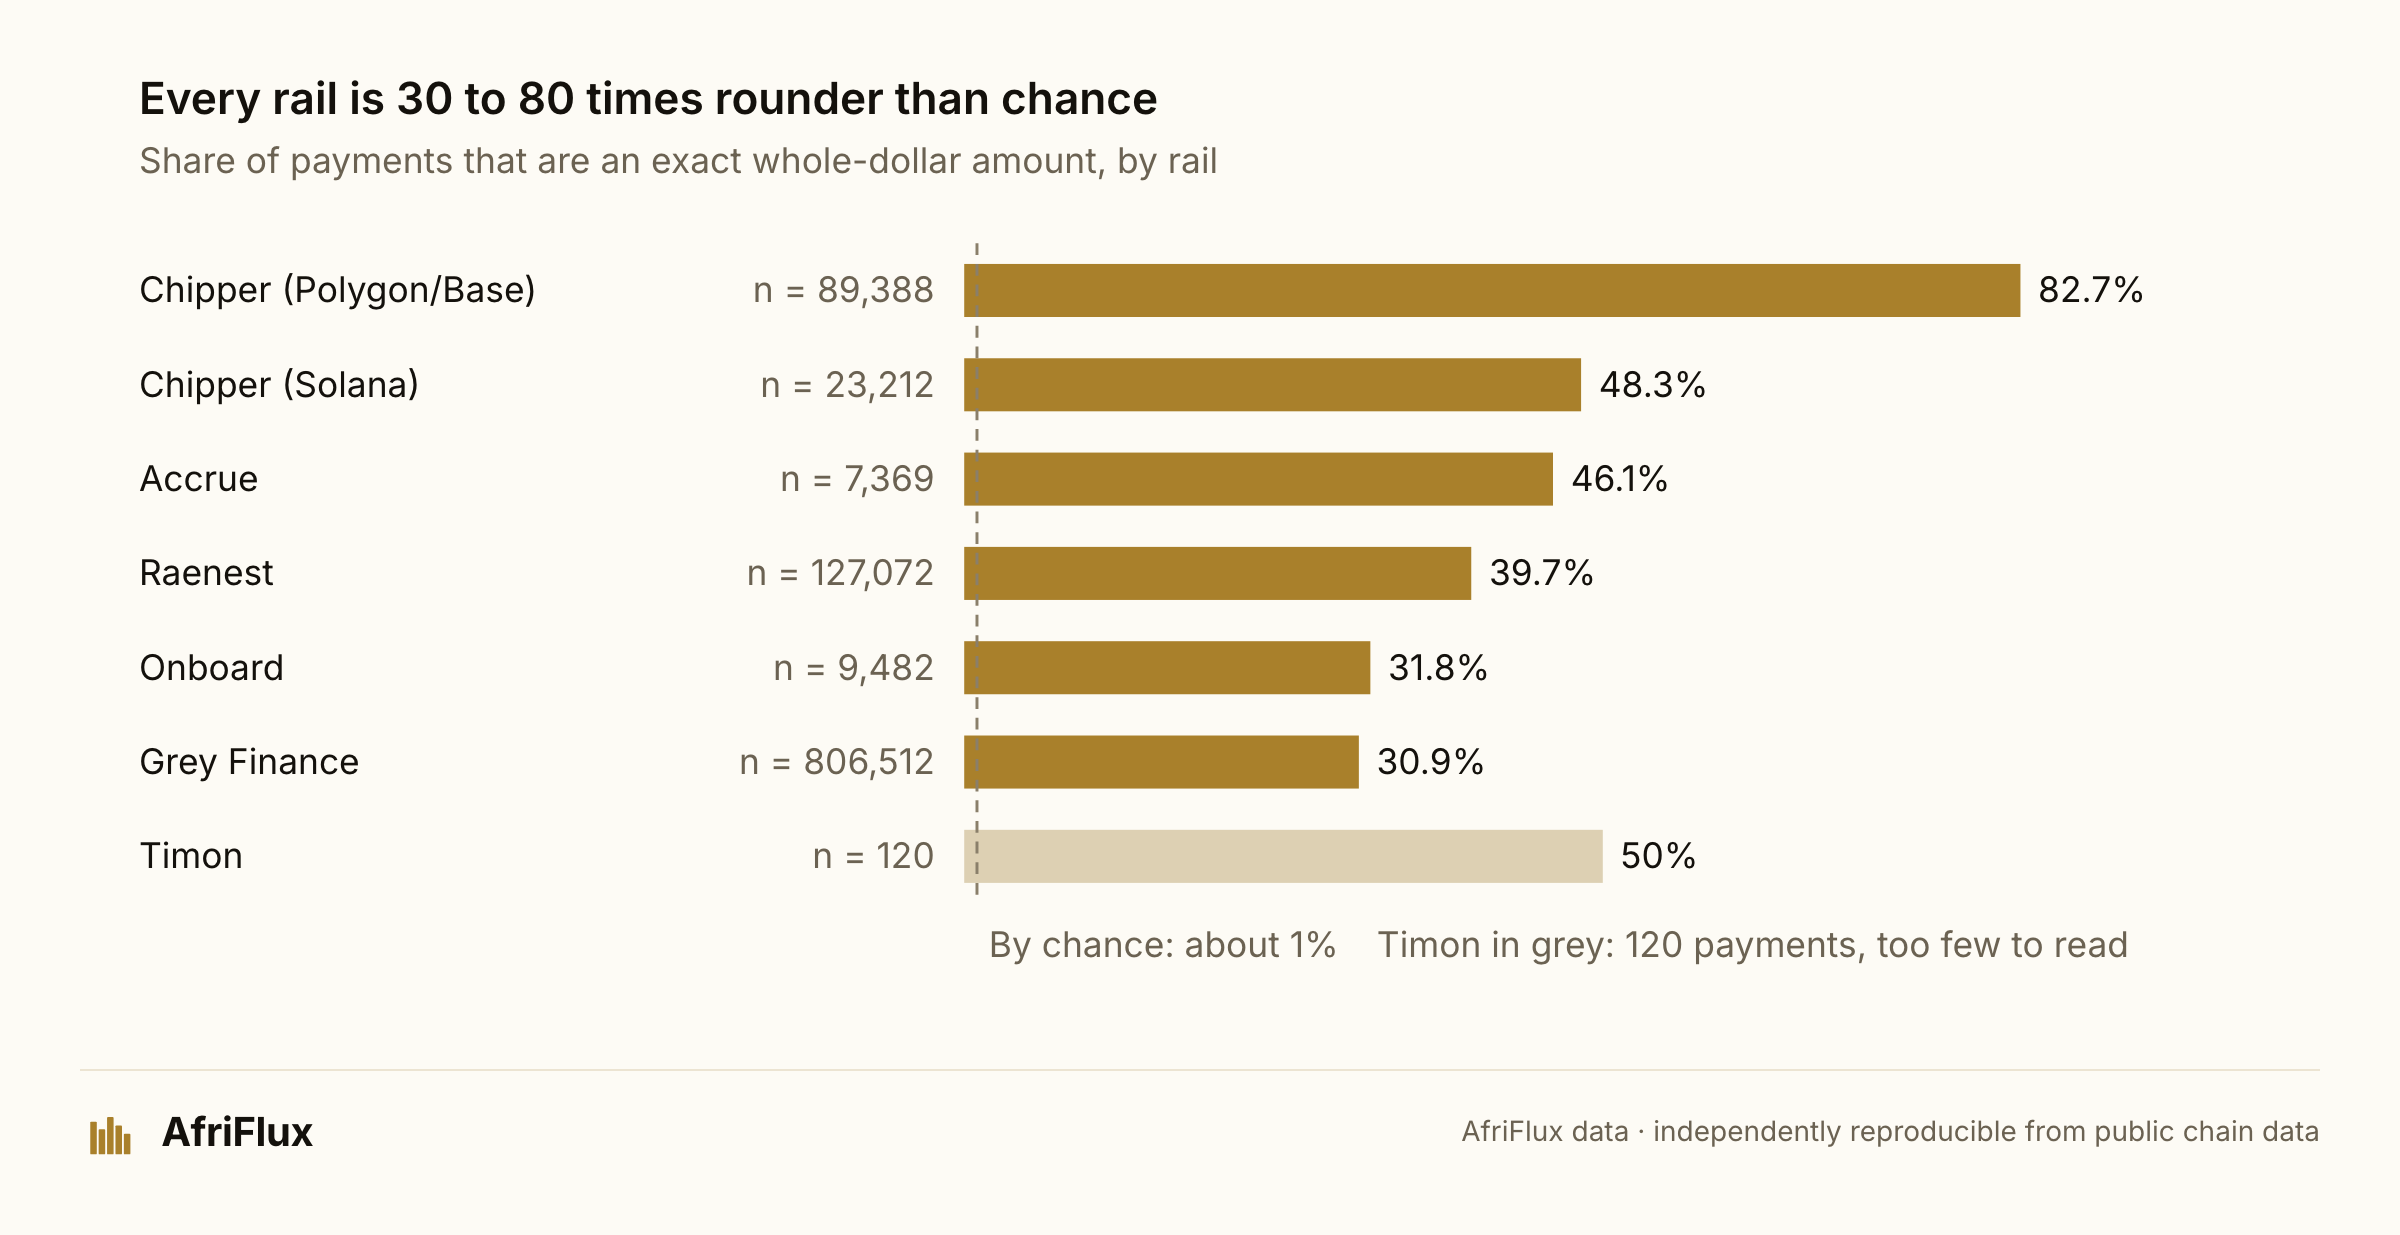
The round share has not drifted. It fell from 87% to 34% across the whole rail since late 2024, but only because Chipper's whole-dollar top-ups gave way to Grey and Raenest; inside Grey, about half of payments over $500 have been exact round amounts in every one of the last seven quarters.
Takeaway: small payments dominate the count, but large payments carry most of the value.
Regular income, rarely a regular salary
If this were payroll, it would arrive on paydays, in the same amount, every month. Almost nothing about it looks like that.
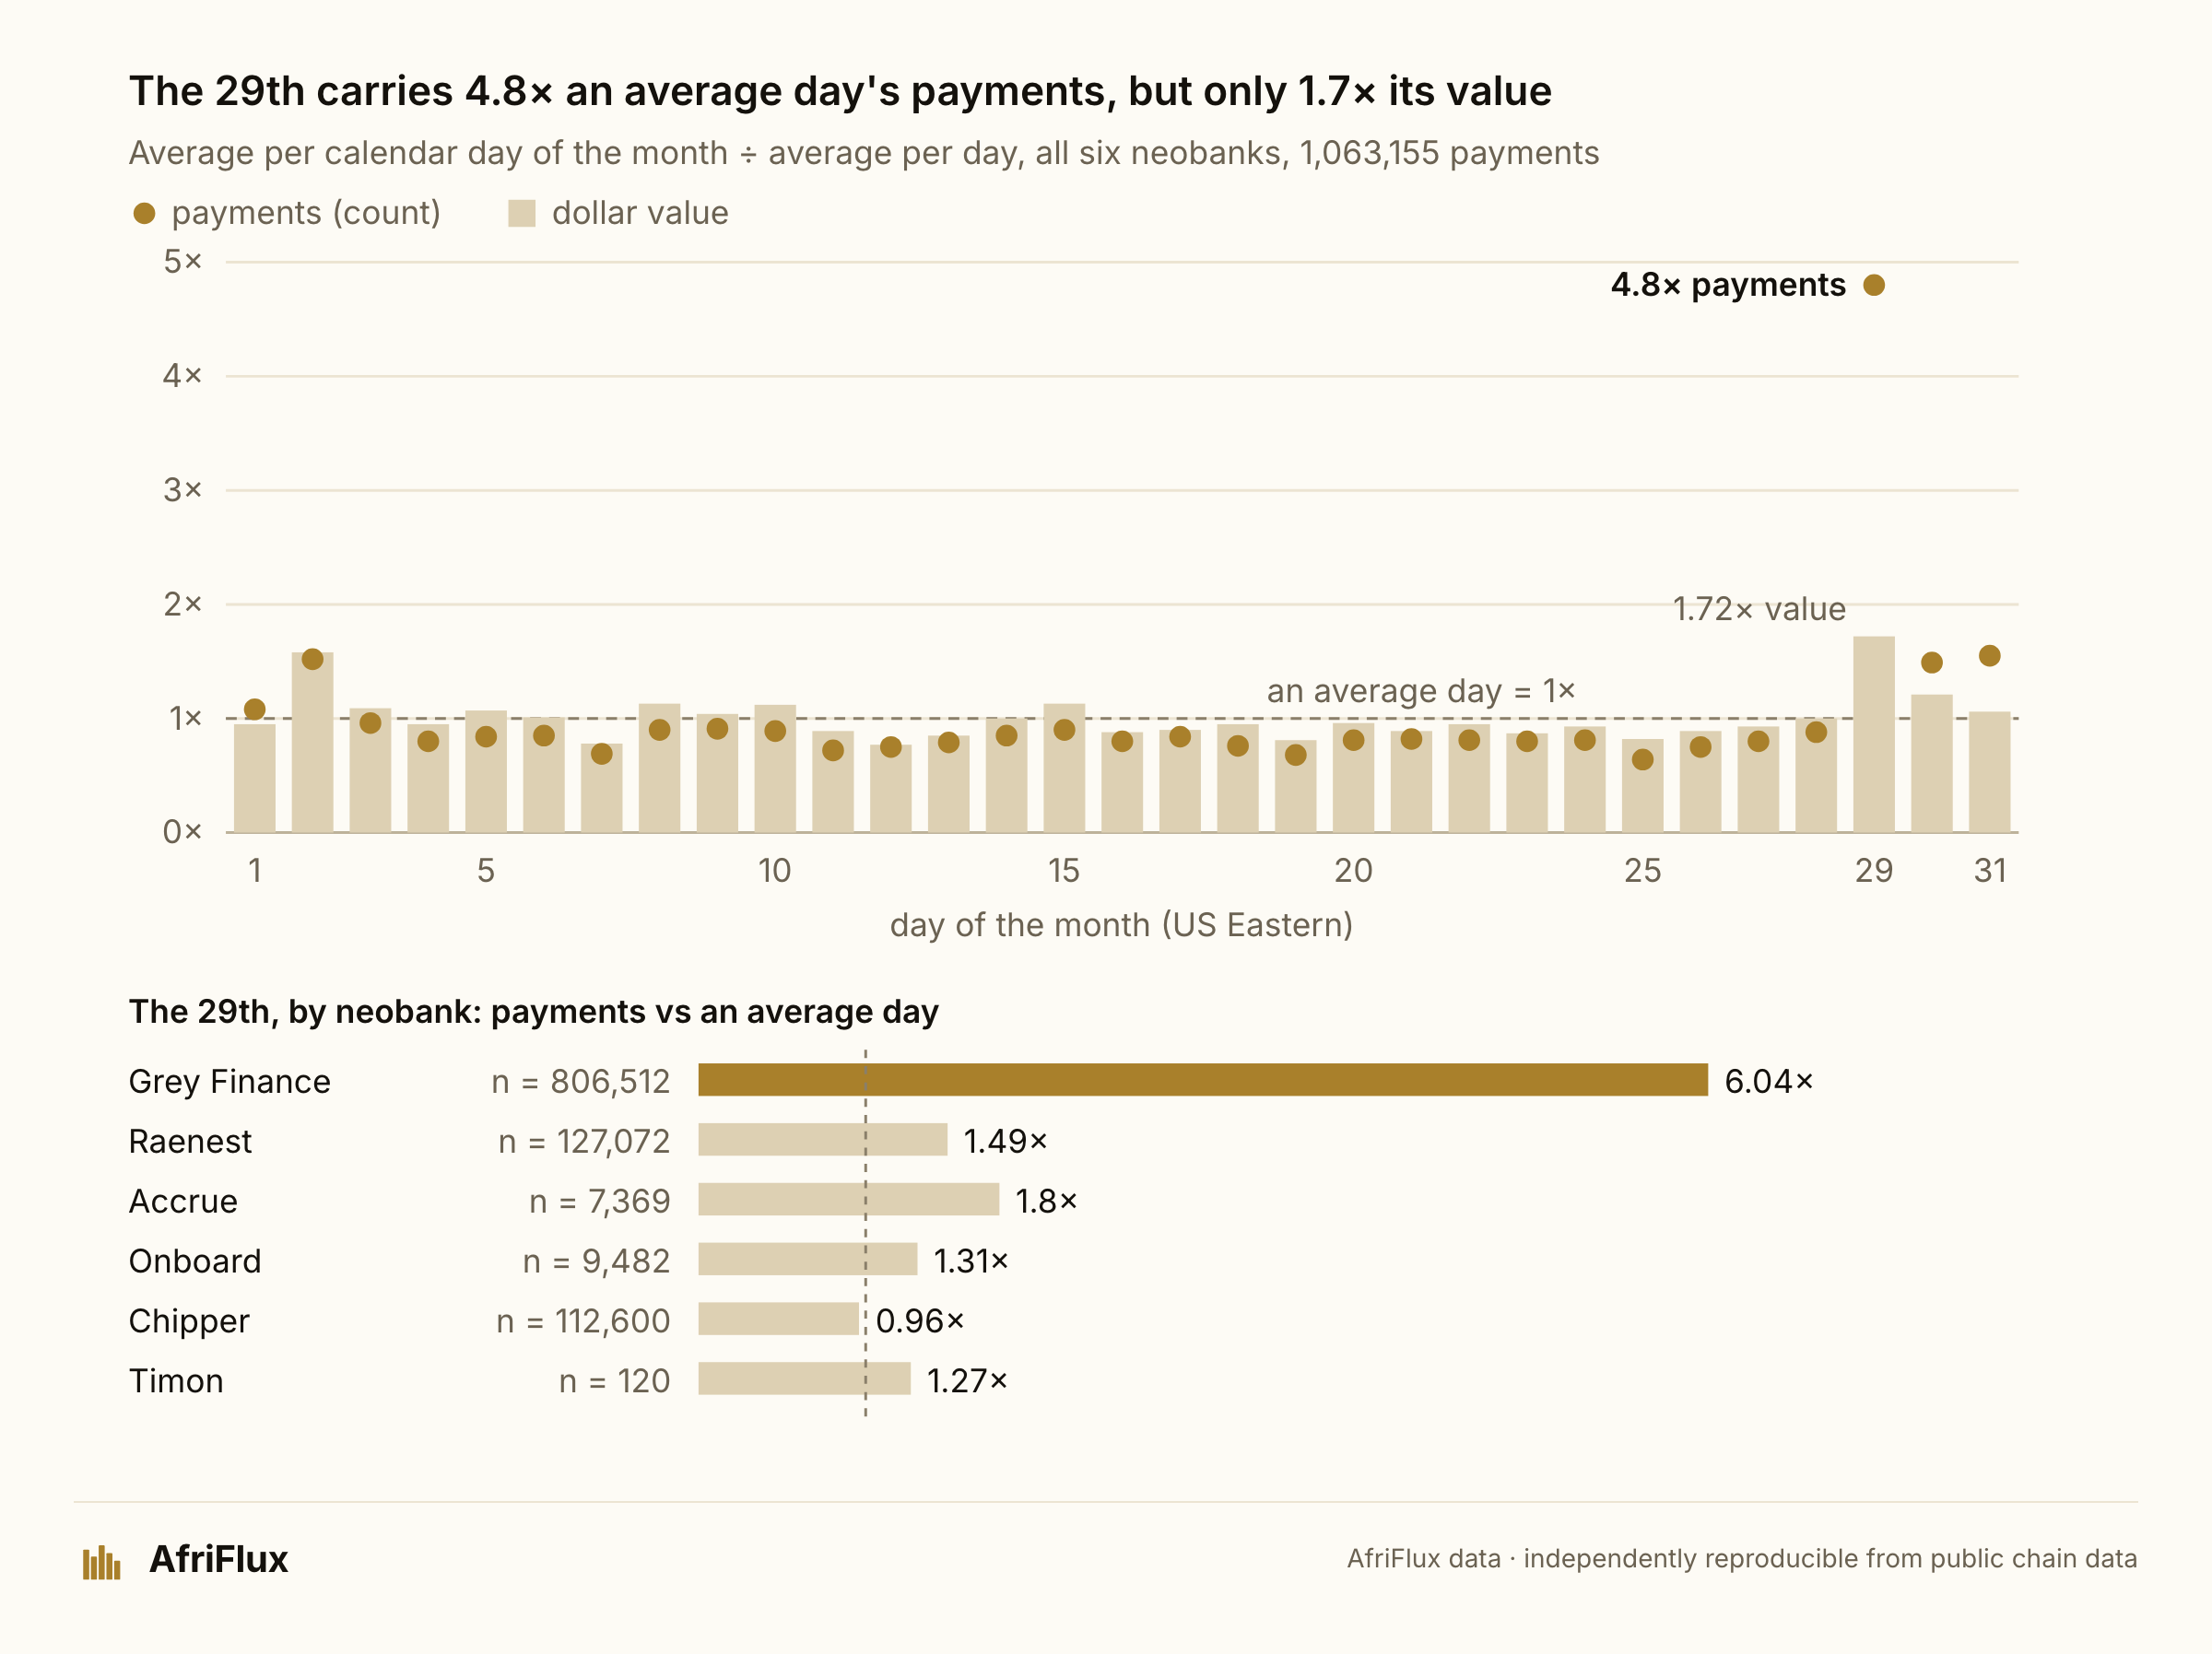
The 29th carries 4.8x an average day's payments but only 1.7x its value. That is Grey's monthly batch of small payments (see "The 29th of every month" below): at Grey alone the 29th runs at 6.0x, at the other neobanks between 1.0x and 1.8x. Away from it, month-end is modest: the 30th and 31st run at about 1.5x in count and 1.1–1.2x in value, and the 2nd at about 1.5x in both. The 15th, the second payday of US semi-monthly payroll, is an ordinary day (0.9x payments, 1.1x value).
The salary question can only be answered where each earner has their own receiving address: Onboard (98.3% of its value), Chipper (79.6% of its payments but only 20.9% of its value), and tiny parts of Grey, Raenest and Accrue, whose money lands in company wallets where we can see payments but not people. Across the rail, per-user addresses carry 2.4% of the value, so every finding about earners describes that slice. We call an earner salaried if they are paid in three or more months, in most months, with a stable monthly amount.
| Neobank | Company wallets | Per-user addresses | Per-user share of payments | Per-user share of value |
|---|---|---|---|---|
| Onboard | 1 | 1,146 | 99.9% | 98.3% |
| Chipper | 3 | 3,231 | 79.6% | 20.9% |
| Accrue | 4 | 28 | 1.8% | 0.6% |
| Raenest | 2 | 56 | 0.3% | 0.4% |
| Grey Finance | 1 | 290 | 0.1% | 0.1% |
| Timon | 1 | 0 | 0% | 0% |
| All six | 12 | 4,751 | 9.5% | 2.4% |
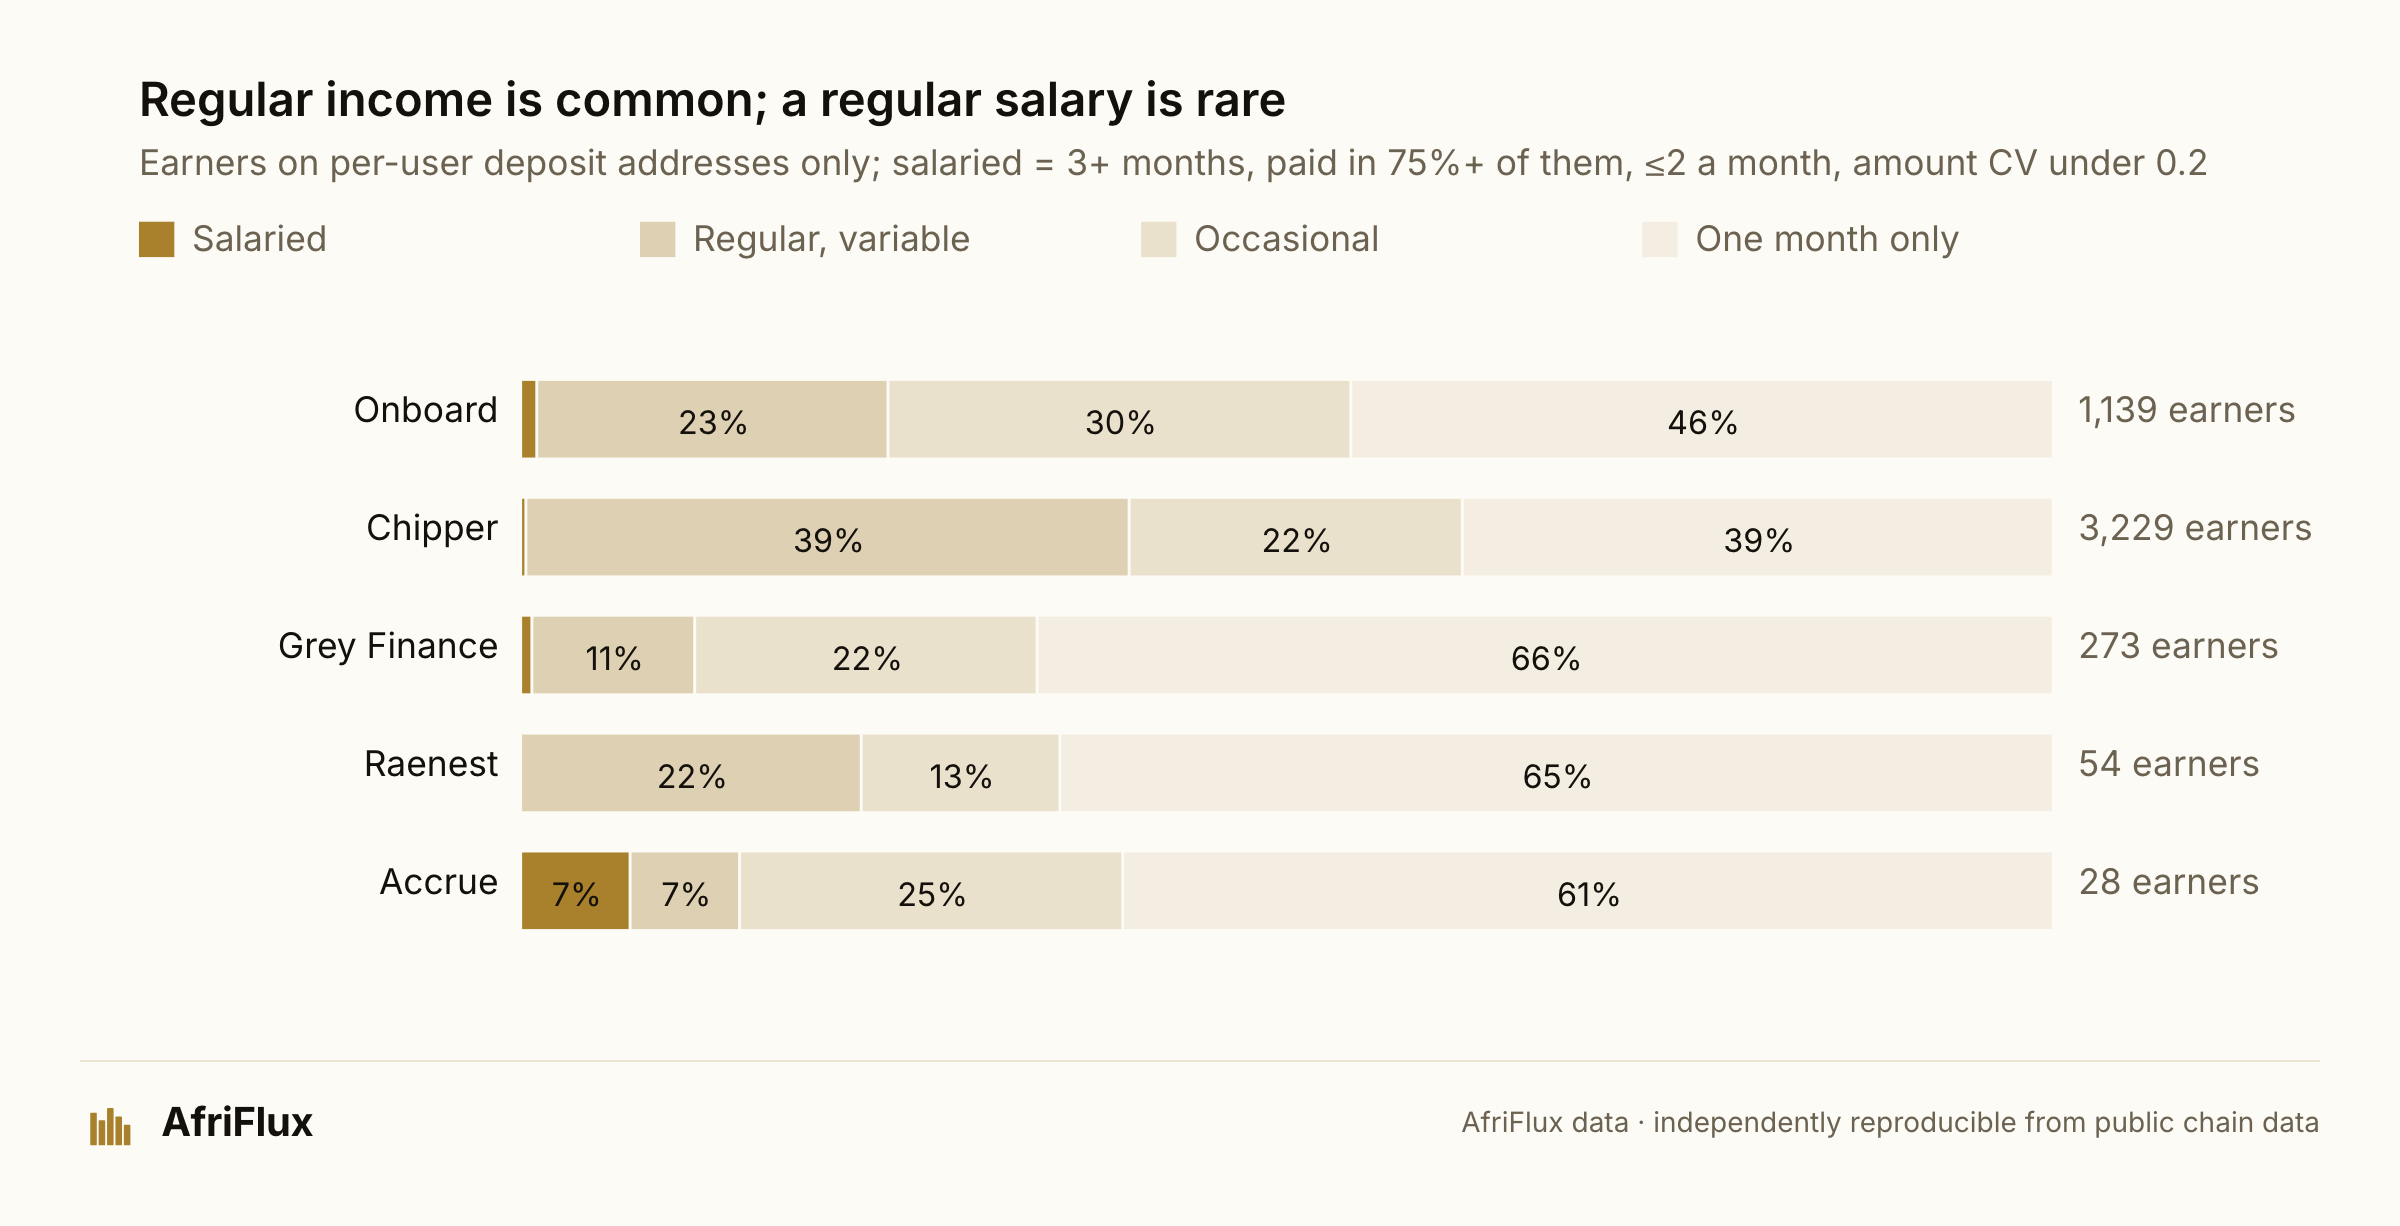
Among the 1,139 analysed Onboard per-user addresses (the coverage table counts 1,146; the seven whose first payment came in November 2026, a partial month worth $946 in all, are left out of the monthly analysis), 12 (1.1%) meet our strict salaried rule, at a typical $1,152 a month; loosening "stable" to variation under 35% still finds only 57 (5%). The larger group is regular but variable: 273 addresses (24%) are paid in most months and carry 61% of Onboard's value, across about 3.7 payments a month: several clients or gigs, not one employer. The money recurs; the amount does not.
Read this narrowly. The rule is strict: a salary that varies month to month, or a payroll that pays irregularly, fails it, so 1.1% is a floor on salary-like income, and it describes Onboard's per-user addresses, not Nigerian dollar-account users at large. The same rule finds two salaried addresses at Grey (of 273), 11 at Chipper (of 3,229), two at Accrue (of 28) and none at Raenest (of 54), but those samples cover small and possibly unrepresentative slices of their volume (see the coverage table above).
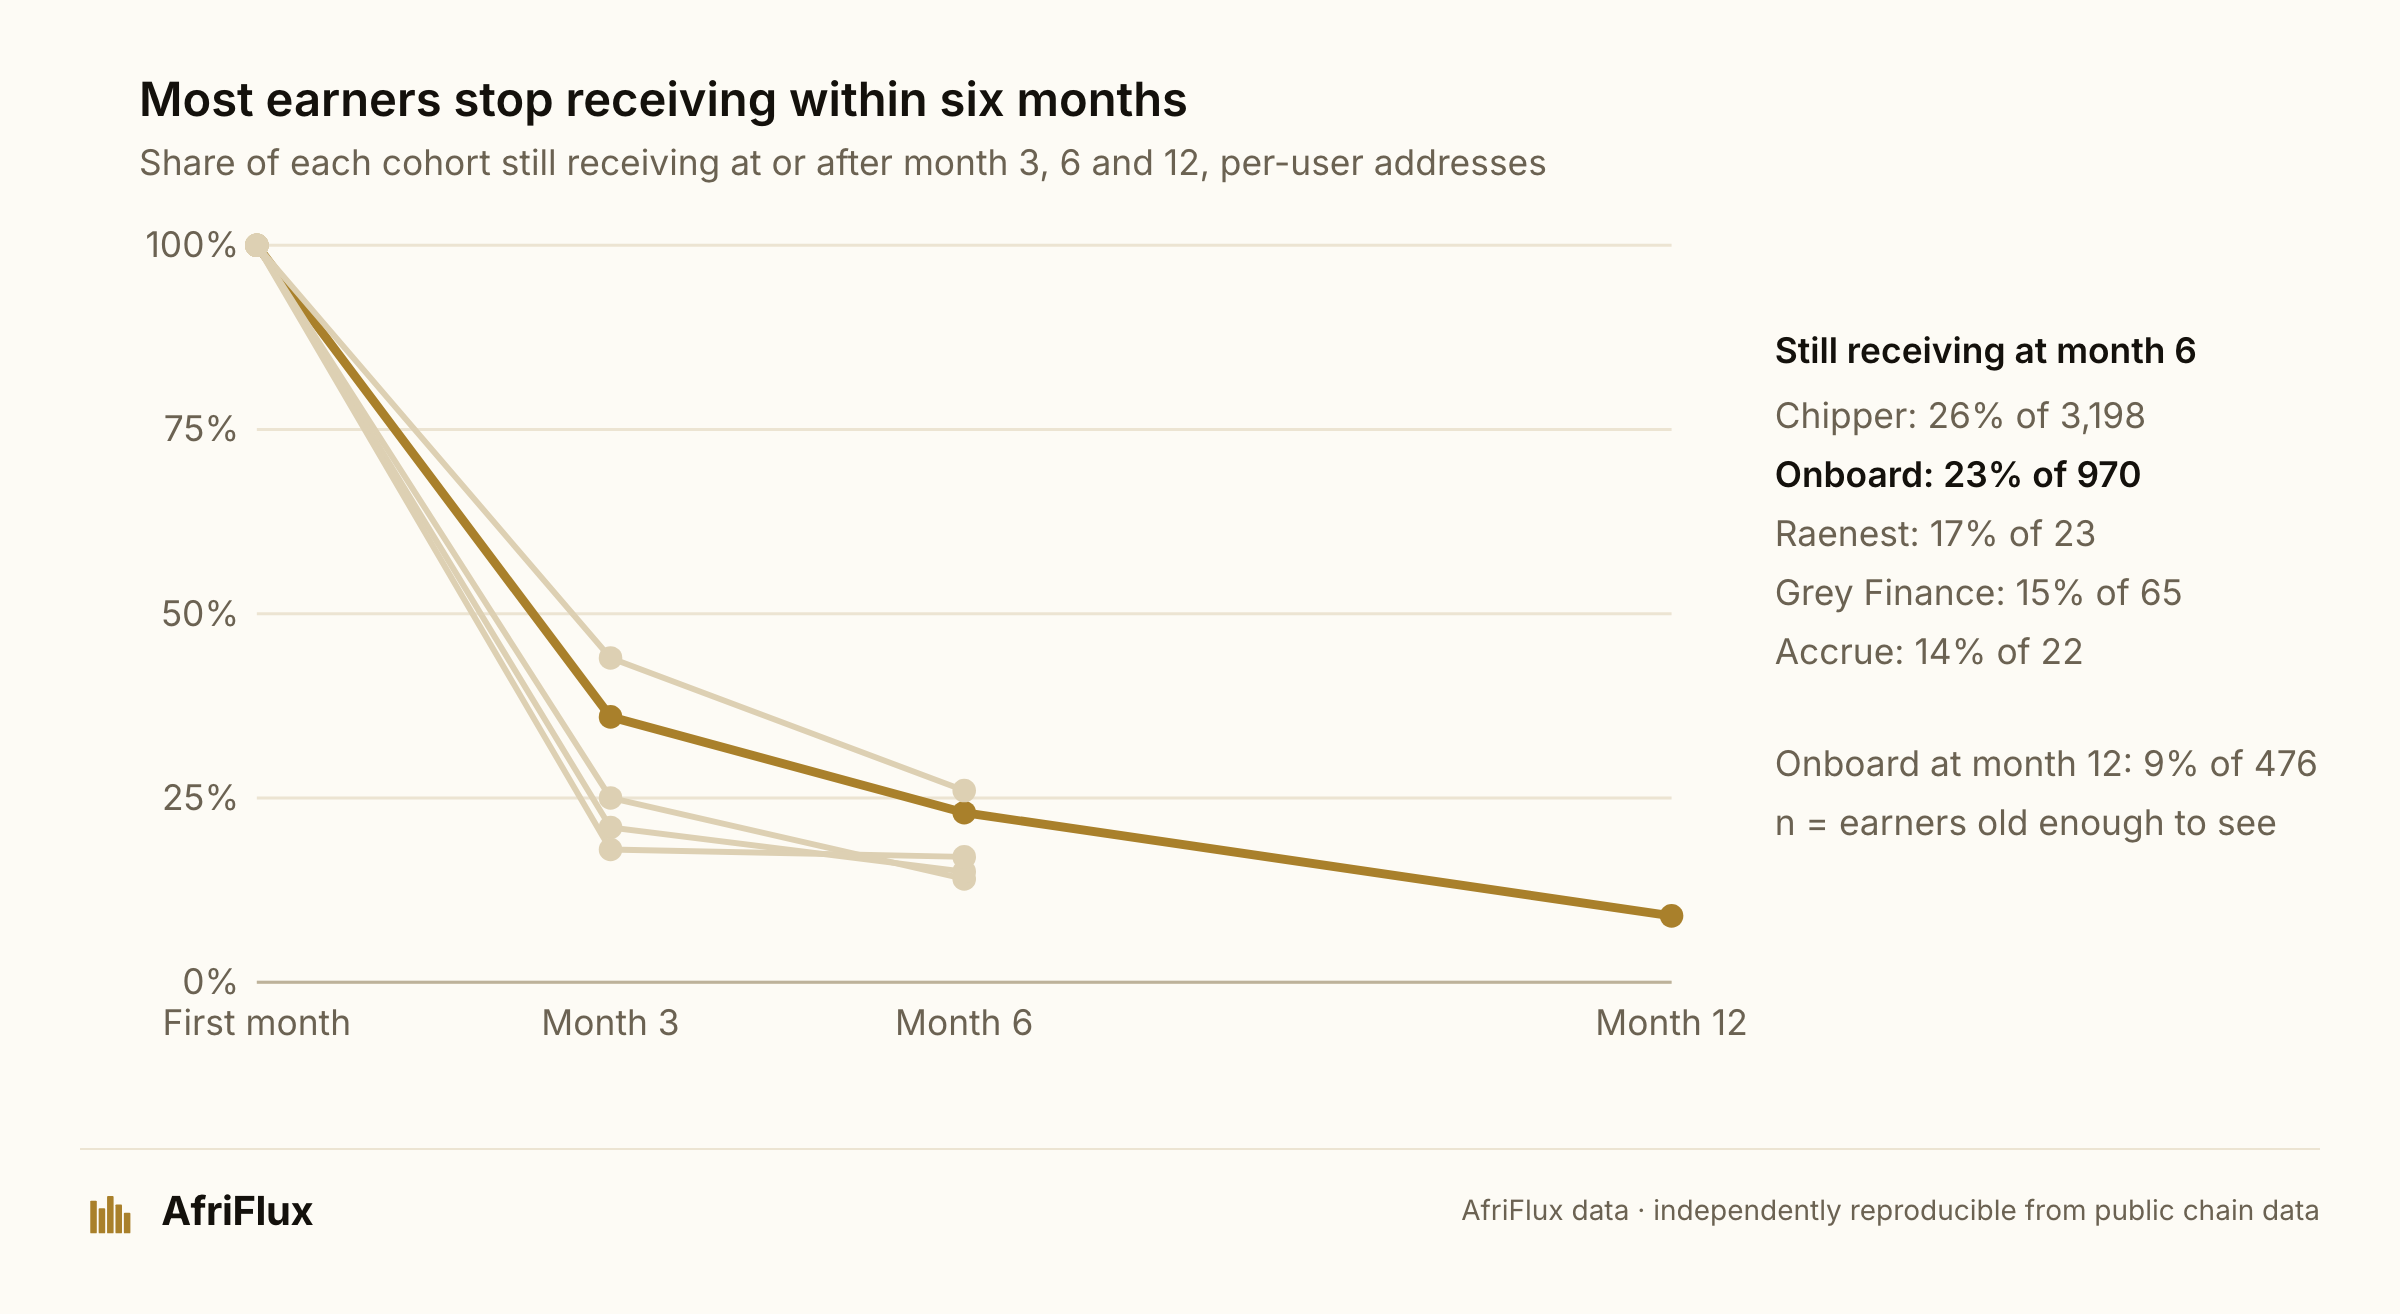
It also does not last. A third of Onboard's earners are still receiving three months after their first payment, 23% at six months and 9% at a year; Grey sits at 15%, Raenest 17% and Accrue 14% by six months, on small cohorts of 65, 23 and 22 addresses. This is continuity of an address, not retention of a customer. Address rotation would make a returning earner look new, so these are a floor, but the shape is a project or a contract, then quiet.
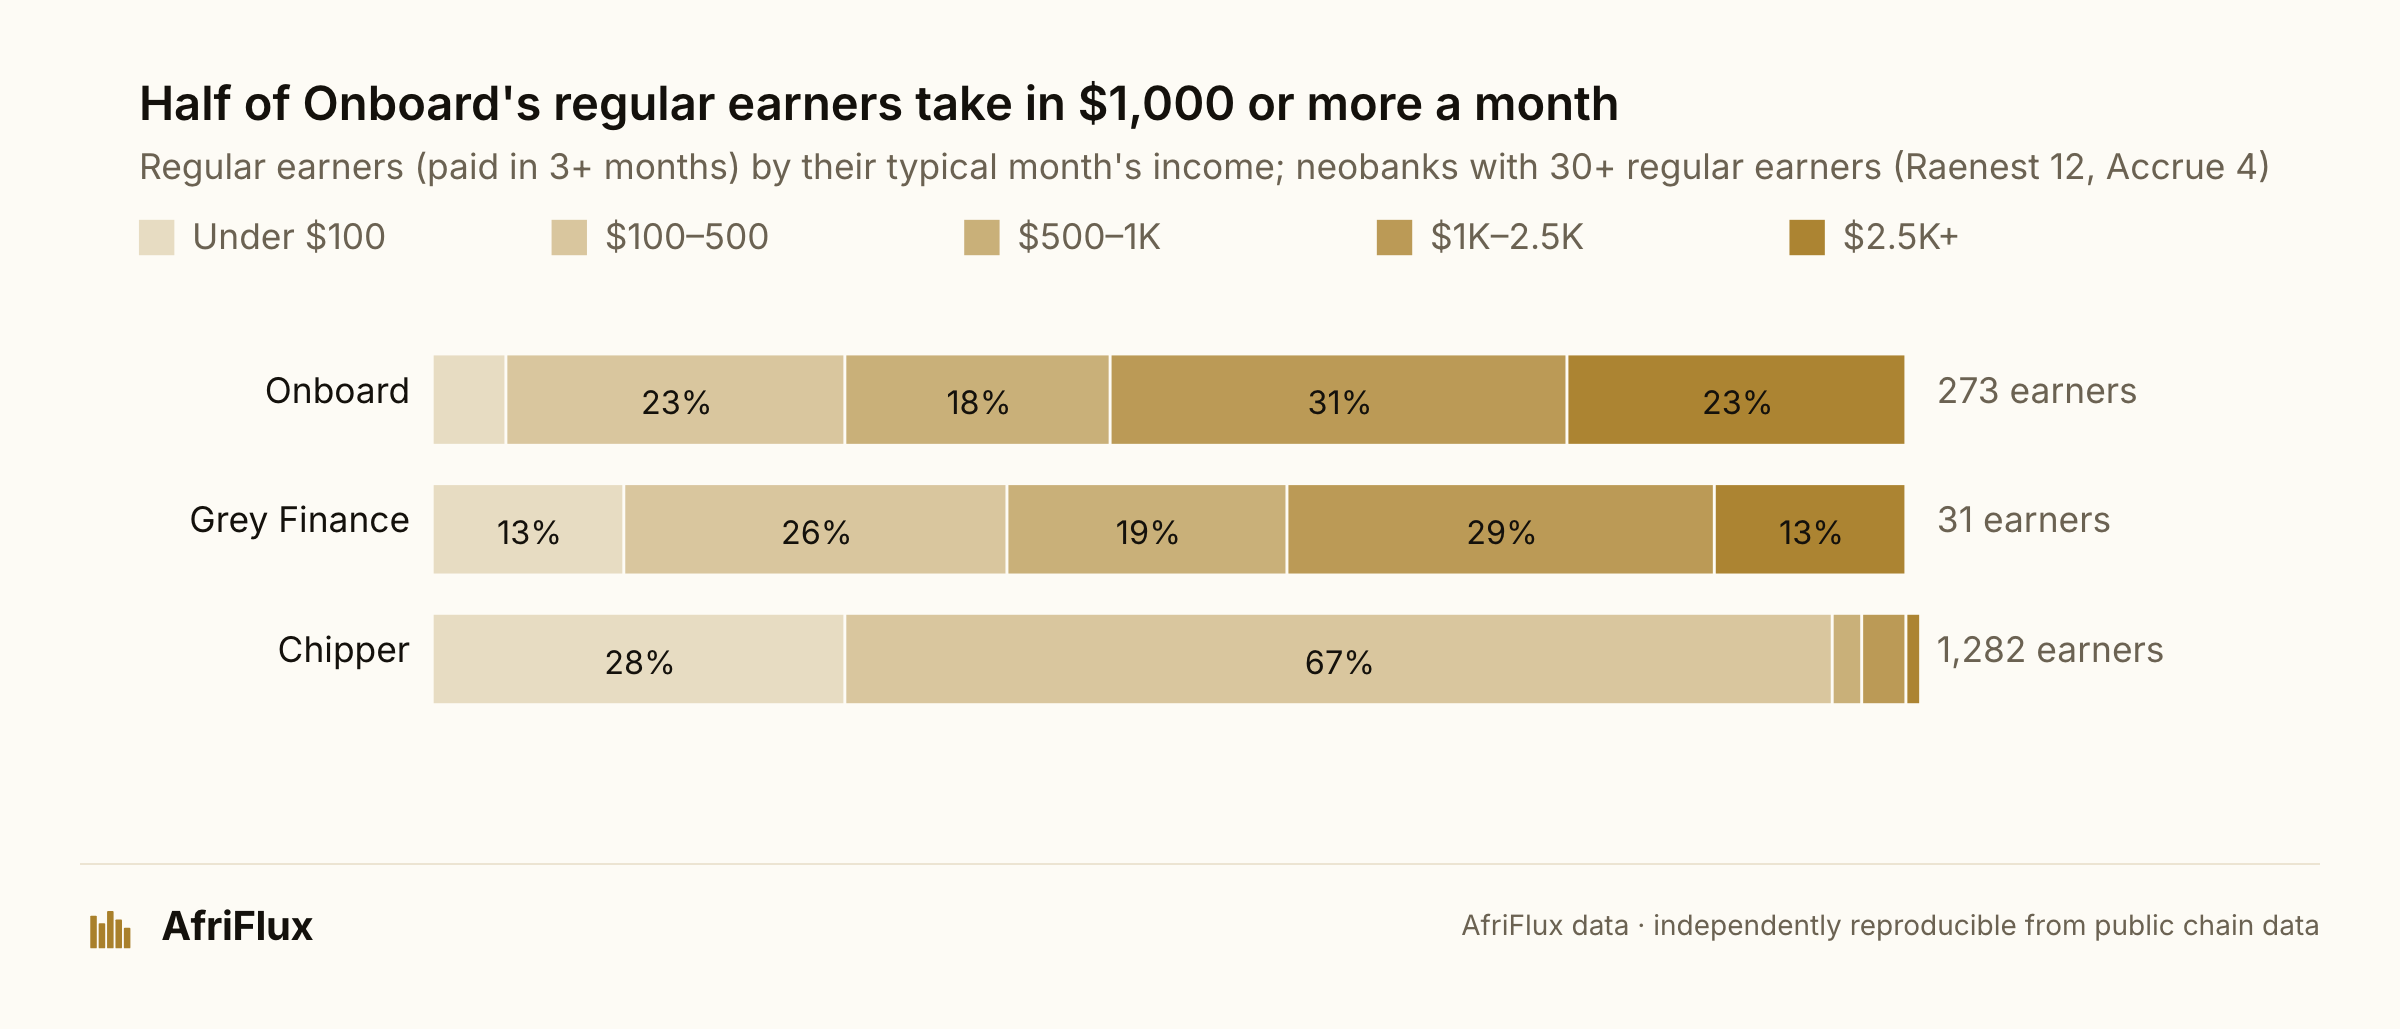
What they earn varies by neobank. 54% of Onboard's 273 regular earners take in $1,000 or more in a typical month, and 23% over $2,500; Chipper's regulars sit almost entirely under $500, closer to top-ups than pay. Over a lifetime the tail is long everywhere: the top 10% of earners hold 57–80% of each neobank's per-user income, and Onboard's median per-user address has received $1,735 in total, with 15.4% past $10,000.
Takeaway: recurring income is visible, but stable monthly salaries are rare in the per-user sample we can observe.
Fingerprints in the flow
Timing and amounts also reveal recurring patterns. We never see who pays or why; three are clear enough to describe (a recurring €1,500-equivalent amount, a monthly batch on the 29th, and the deduction patterns left in near-round amounts) and all three are written here as pattern detection, not identification.
A recurring €1,500-equivalent pattern
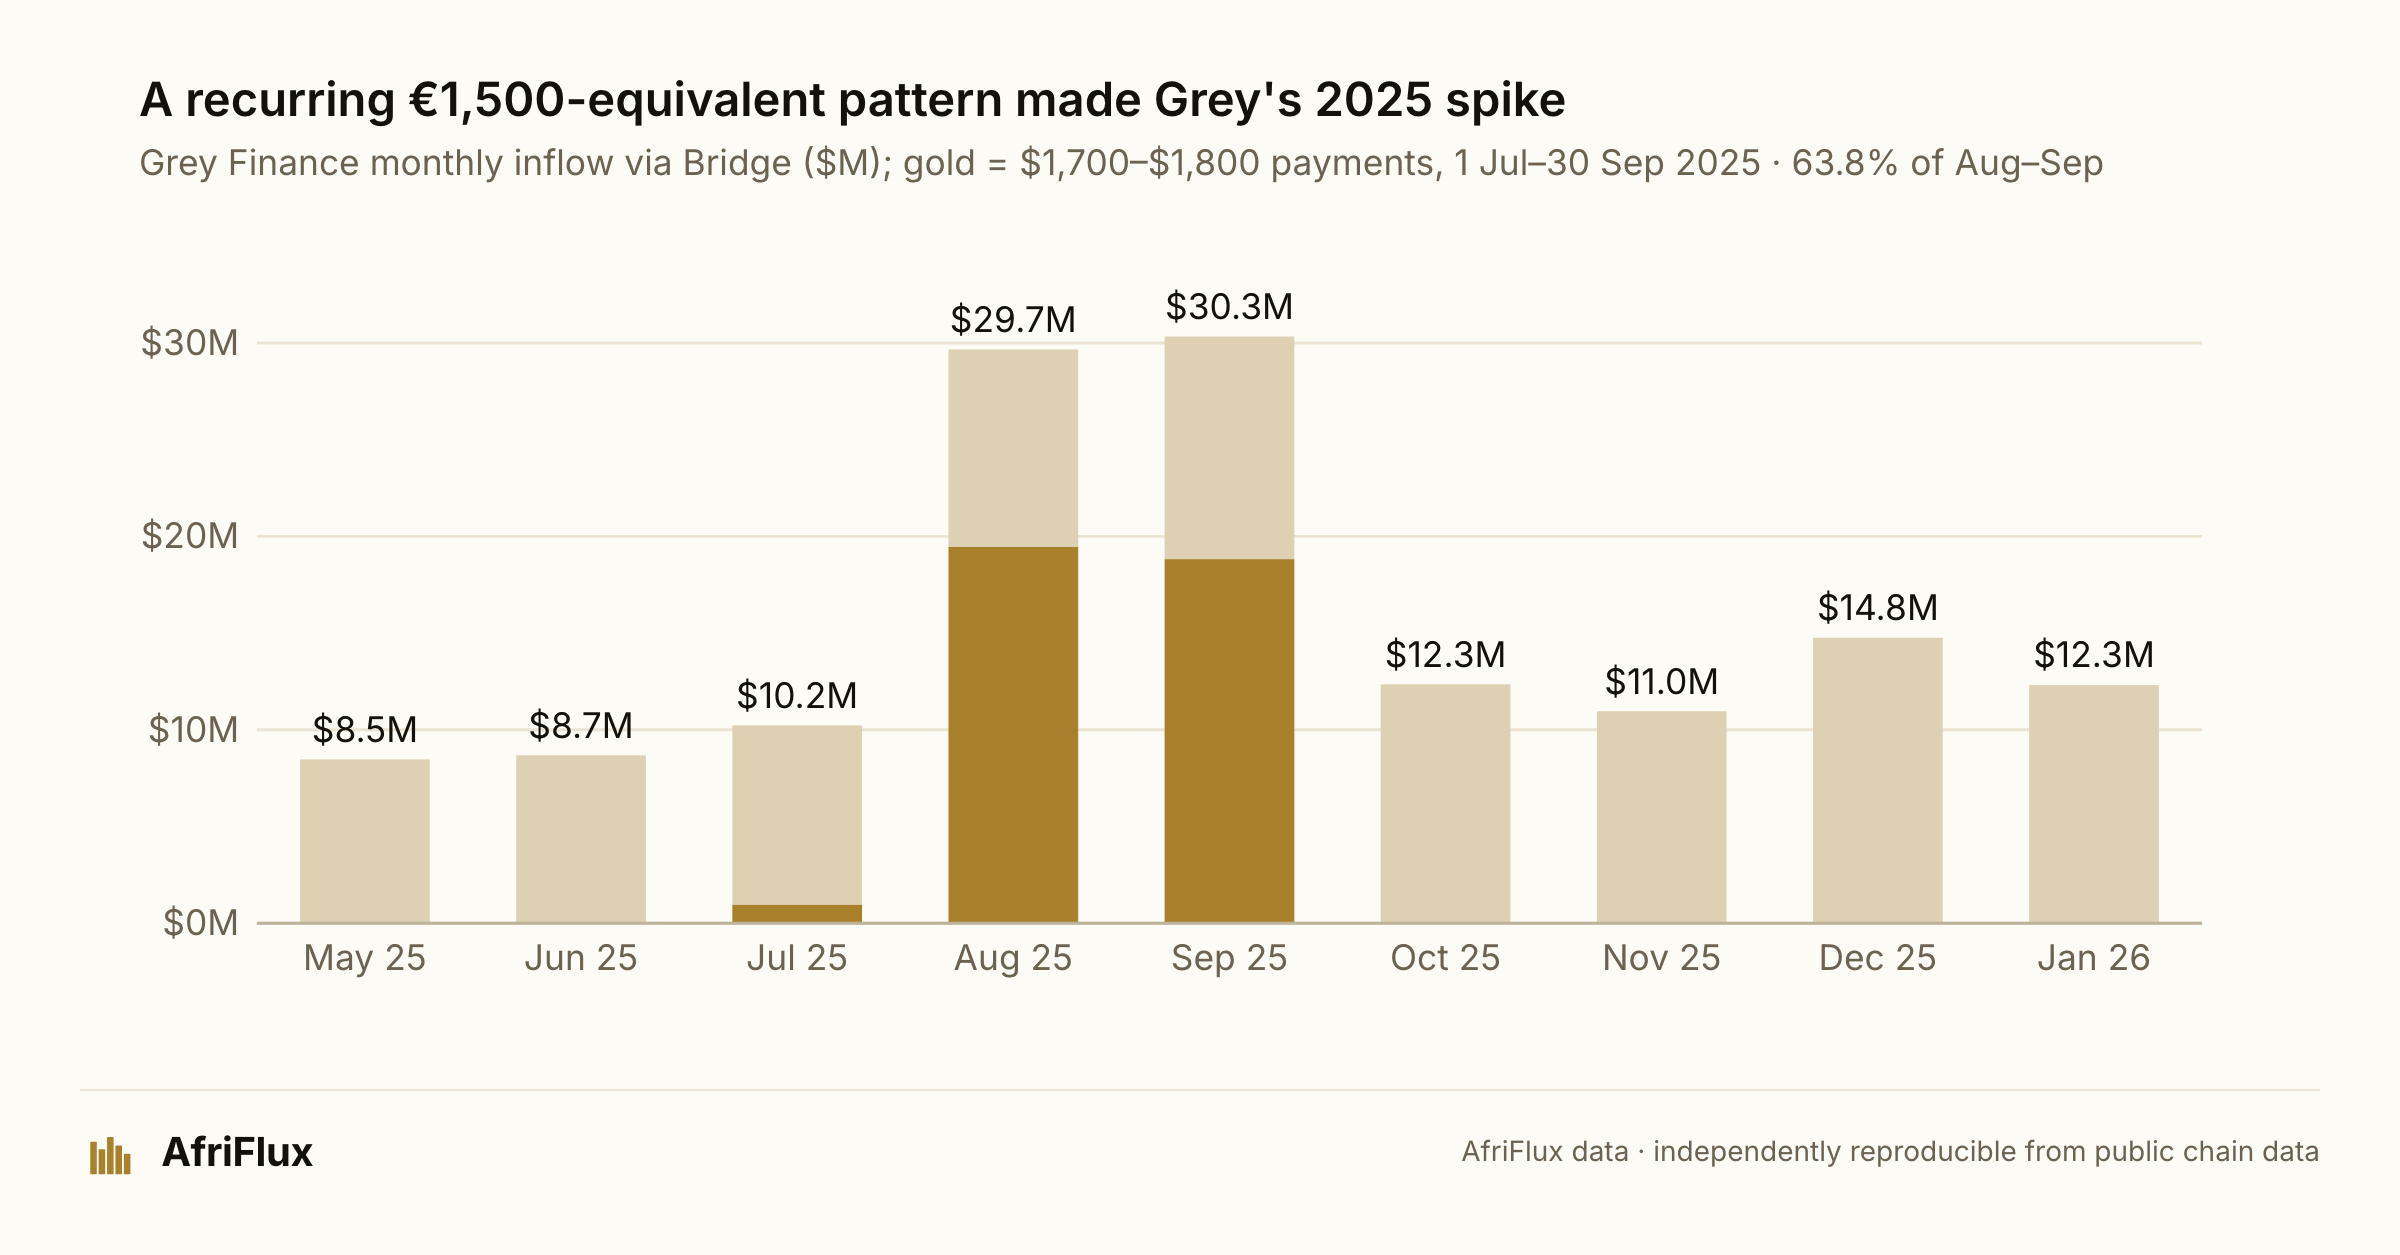
Between 1 July and 30 September 2025 (Eastern dates), Grey received 22,474 payments of $1,700–$1,800, worth $39.21M, each exact amount repeated hundreds of times over a few days. August had 11,187 of them and September 10,741; October had 250, close to the band's normal background of about 55 a month. August and September alone were $38.26M, 63.8% of Grey's volume in those two months, and they are why September 2025 looked like a record month.
The dollar amounts drift day to day, which is what a fixed amount in another currency looks like after conversion. Divided by that day's EUR/USD rate, every one comes to about €1,492: €1,500 less a conversion spread of roughly 0.5%.
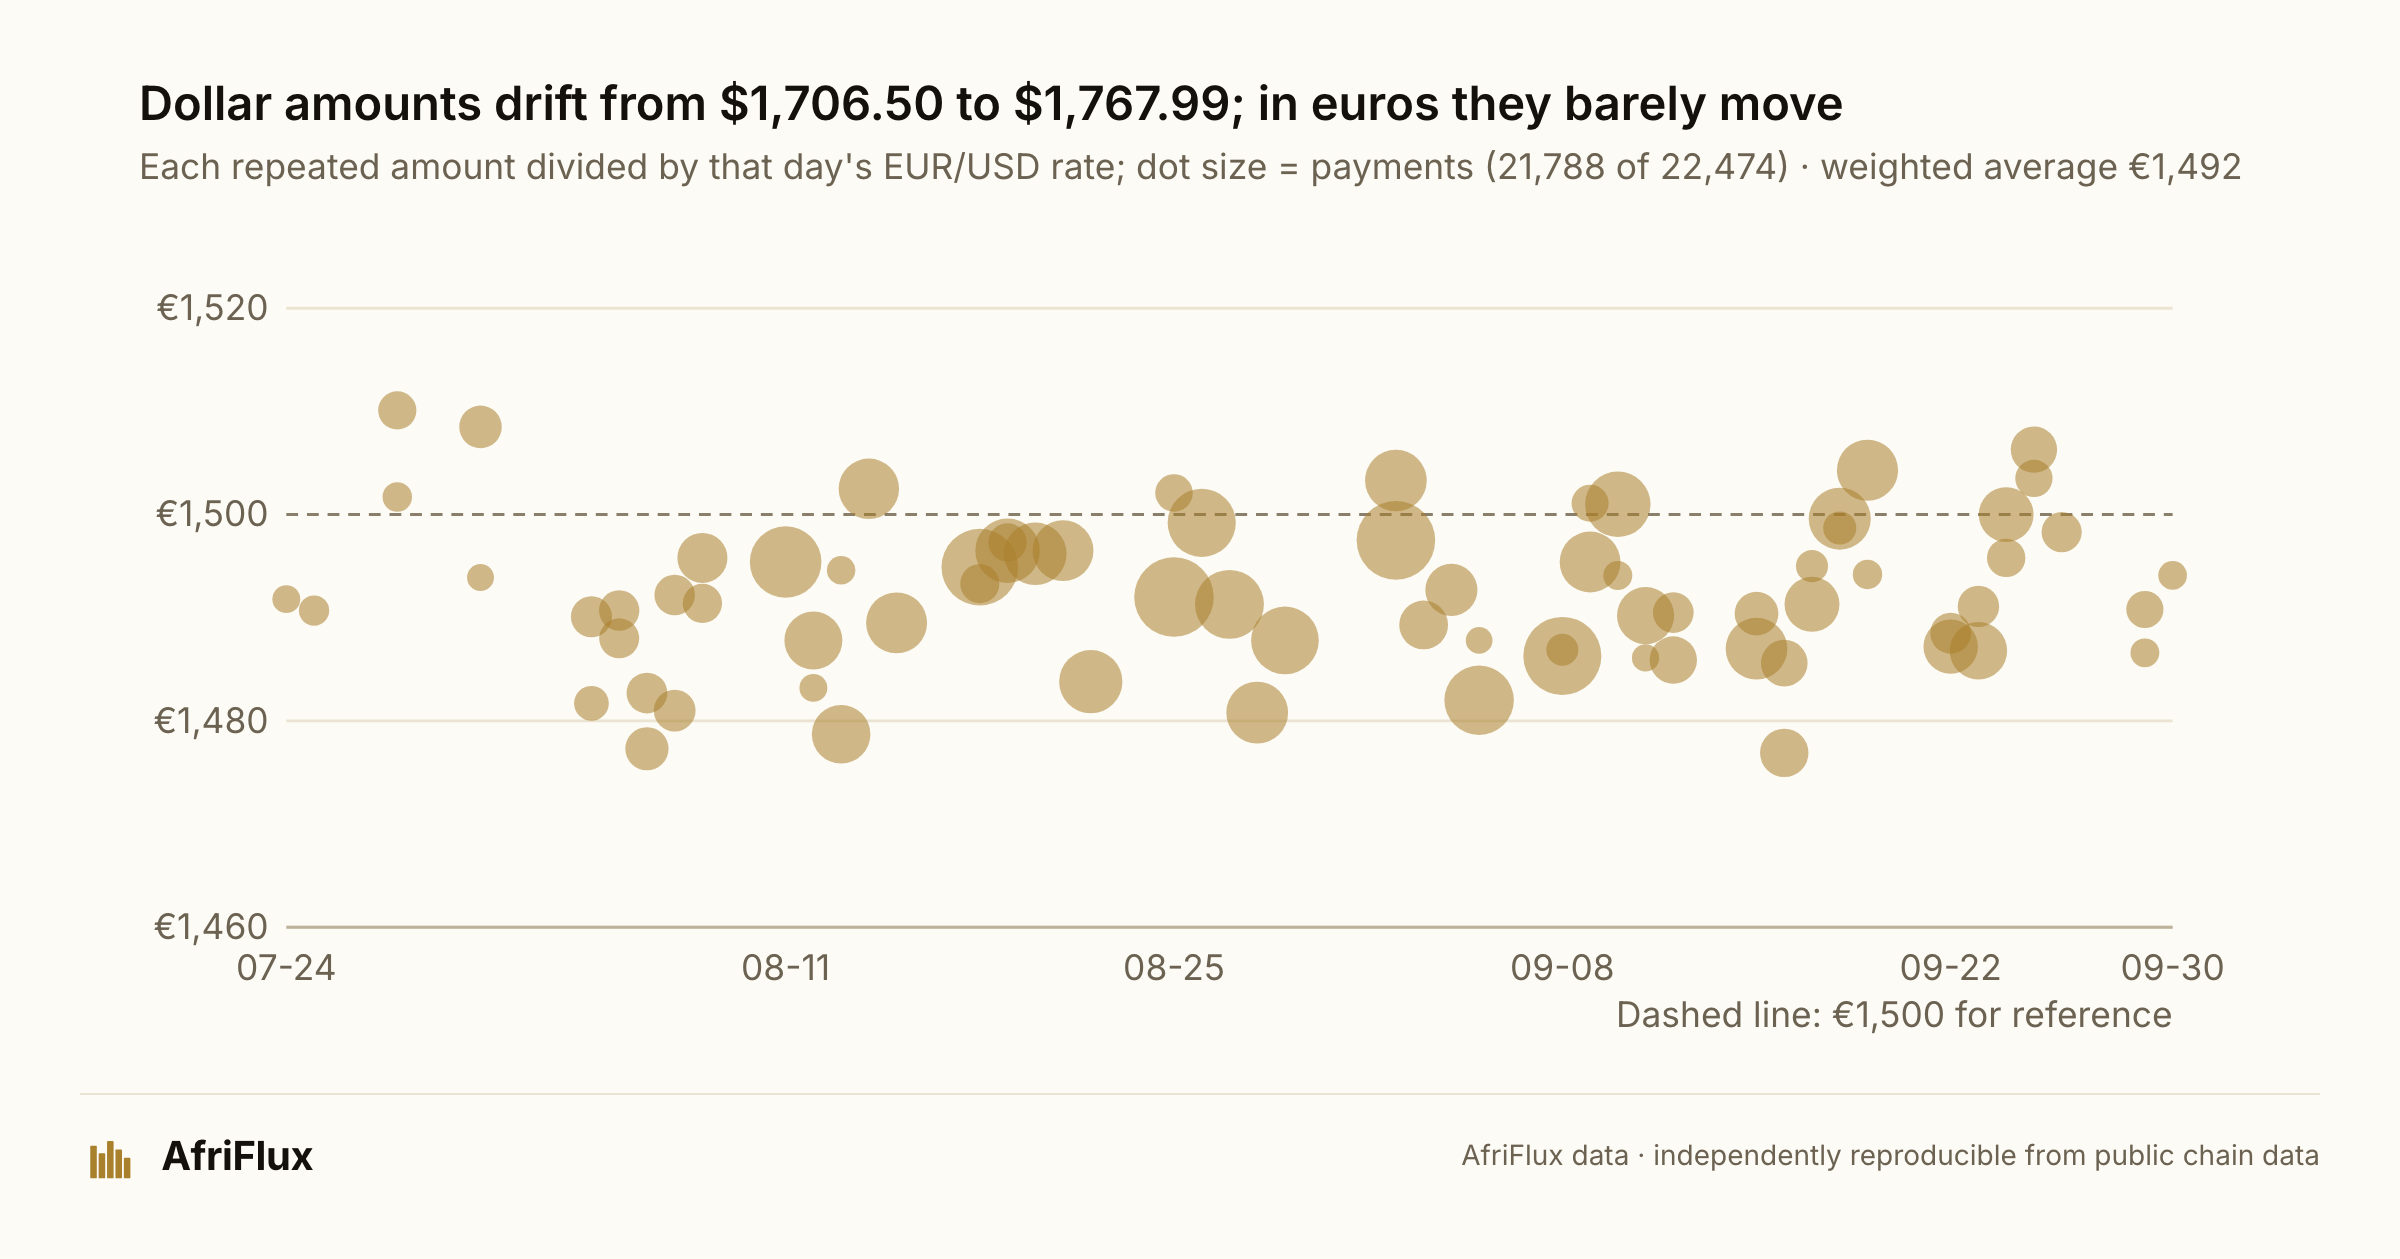
It is a recurring €1,500-equivalent payment pattern. The payer, the recipients and the purpose are unknown. Similar counts in August and September do not show that the same recipients were paid twice: Grey receives into one pooled wallet, so we cannot tell how many people this was, who paid them, or why.
The 29th of every month
The second pattern is smaller and still running. On the 29th of each month (or the next business day when the 29th is a weekend, a US holiday or missing) Grey receives a single burst of small payments: about 9,000–10,000 under $50, against about 300 on a normal day, worth $100,000–$143,000 a batch, all on Solana.
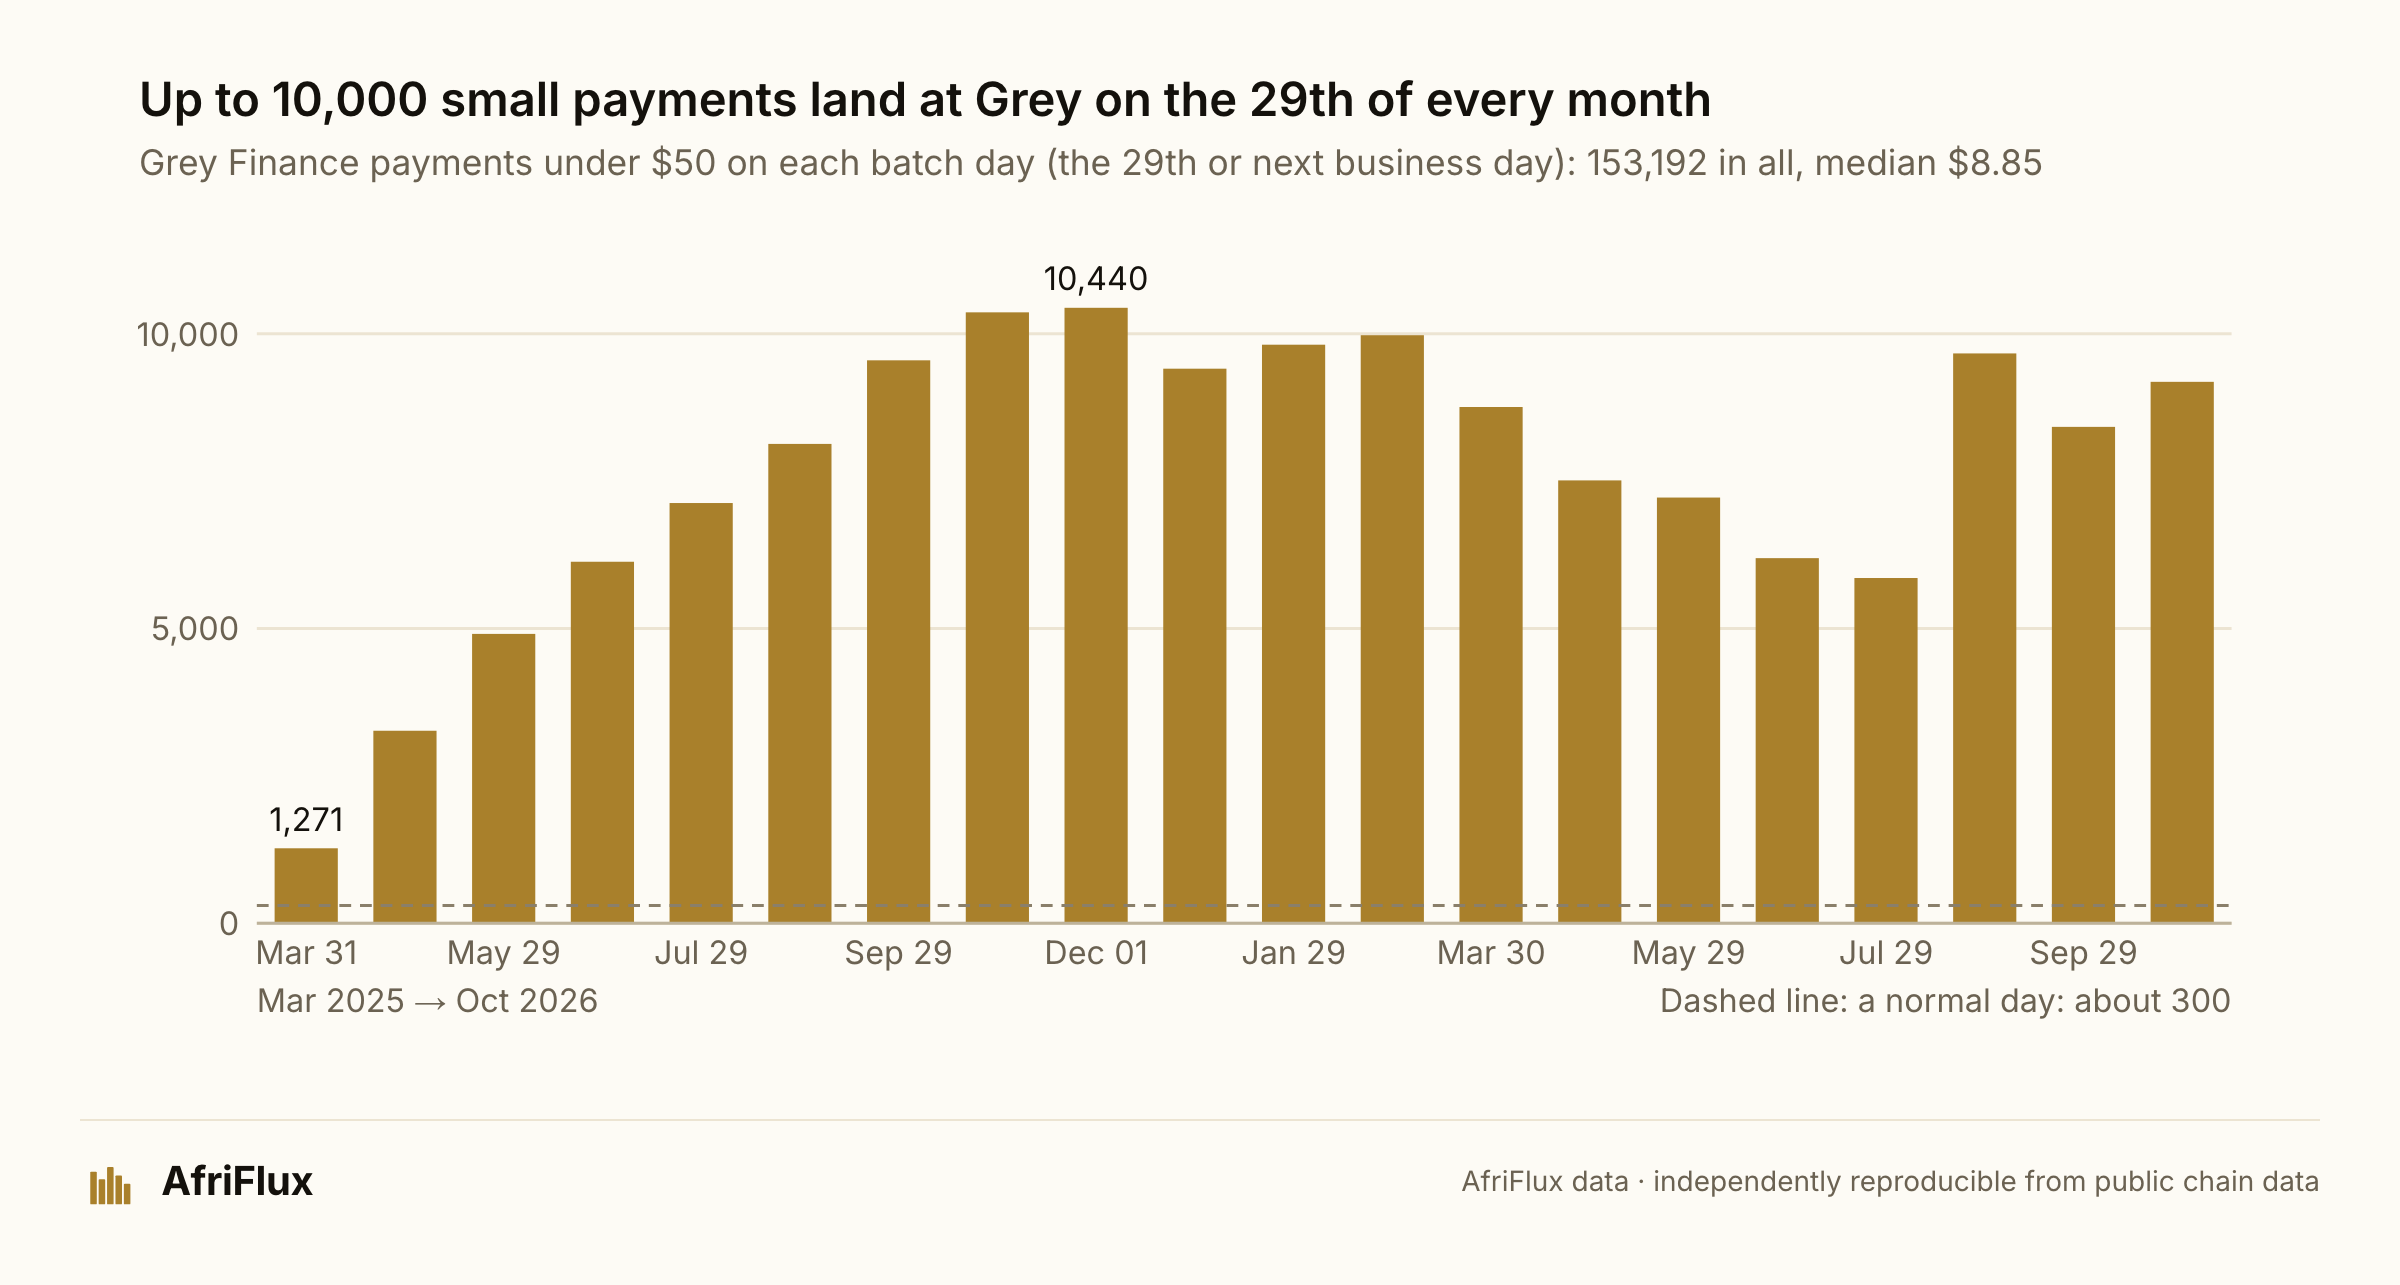
Only 2–3% of these are whole dollars, so they are computed earnings, not invoices: a recurring pattern consistent with a monthly payout to many contributors; the payer and the purpose are not identified. It is why $13 is the third most common amount on the whole rail. On 31 August 2026 a matching pattern appears at Raenest: 5,720 payments that day, peaking at the same 10–11am Eastern, with 1,633 exact sub-$50 amounts found at both neobanks, consistent with one payer, though a shared payment processor could produce the same overlap. No weekly payout batch shows anywhere: these patterns are monthly.
The fee leaves a fingerprint
People invoice in round numbers, so a payment that lands just under one shows what was taken on the way: $98.87 is most likely $100 less a flat $1.13. Six deduction patterns repeat across thousands of payments. Every one appears at several neobanks, which suggests they are taken upstream, before Bridge, rather than by the neobanks. They are inferred from amounts, not a published or complete fee schedule:
| Deduction pattern | Payments matched | Where it appears | Sizes it hits |
|---|---|---|---|
| Flat $1.13 | 20,716 | All five (Grey 16,564) | $25 to $500K, every size |
| 0.83% | 7,441 | Grey, Raenest, Chipper, Onboard | $60–$600 only |
| 3% | 6,441 | Grey, Raenest, Chipper, Accrue | $40–$165 only |
| 1% | 4,853 | All five; Onboard's main one | $40–$500 |
| Flat $0.80 | 4,553 | Chipper, Grey, Raenest | small to mid |
| Flat $2.99 | 3,562 | Raenest, Grey, Chipper | mid |
Percentage deductions hit only small and mid payments; the flat $1.13 runs across every size. And because a third of payments land as exact round numbers, neither Bridge nor the neobanks take a visible cut before the money arrives: whatever the neobanks charge happens later, in their apps. This method only catches payments whose original amount was a multiple of $5, about 4% of Grey's, so it shows which schedules exist, not total fees paid.
Takeaway: amounts and timing alone expose a handful of recurring patterns, which can move a neobank's monthly total. Who is behind them, and why, stays unknown.
Two funding models, and how each grows
A dollar account means different things at different neobanks. Setting each one's lifetime Bridge inflow beside its own lifetime crypto deposits splits them cleanly. The two are shown as separate components, not a complete picture of each neobank's funding.
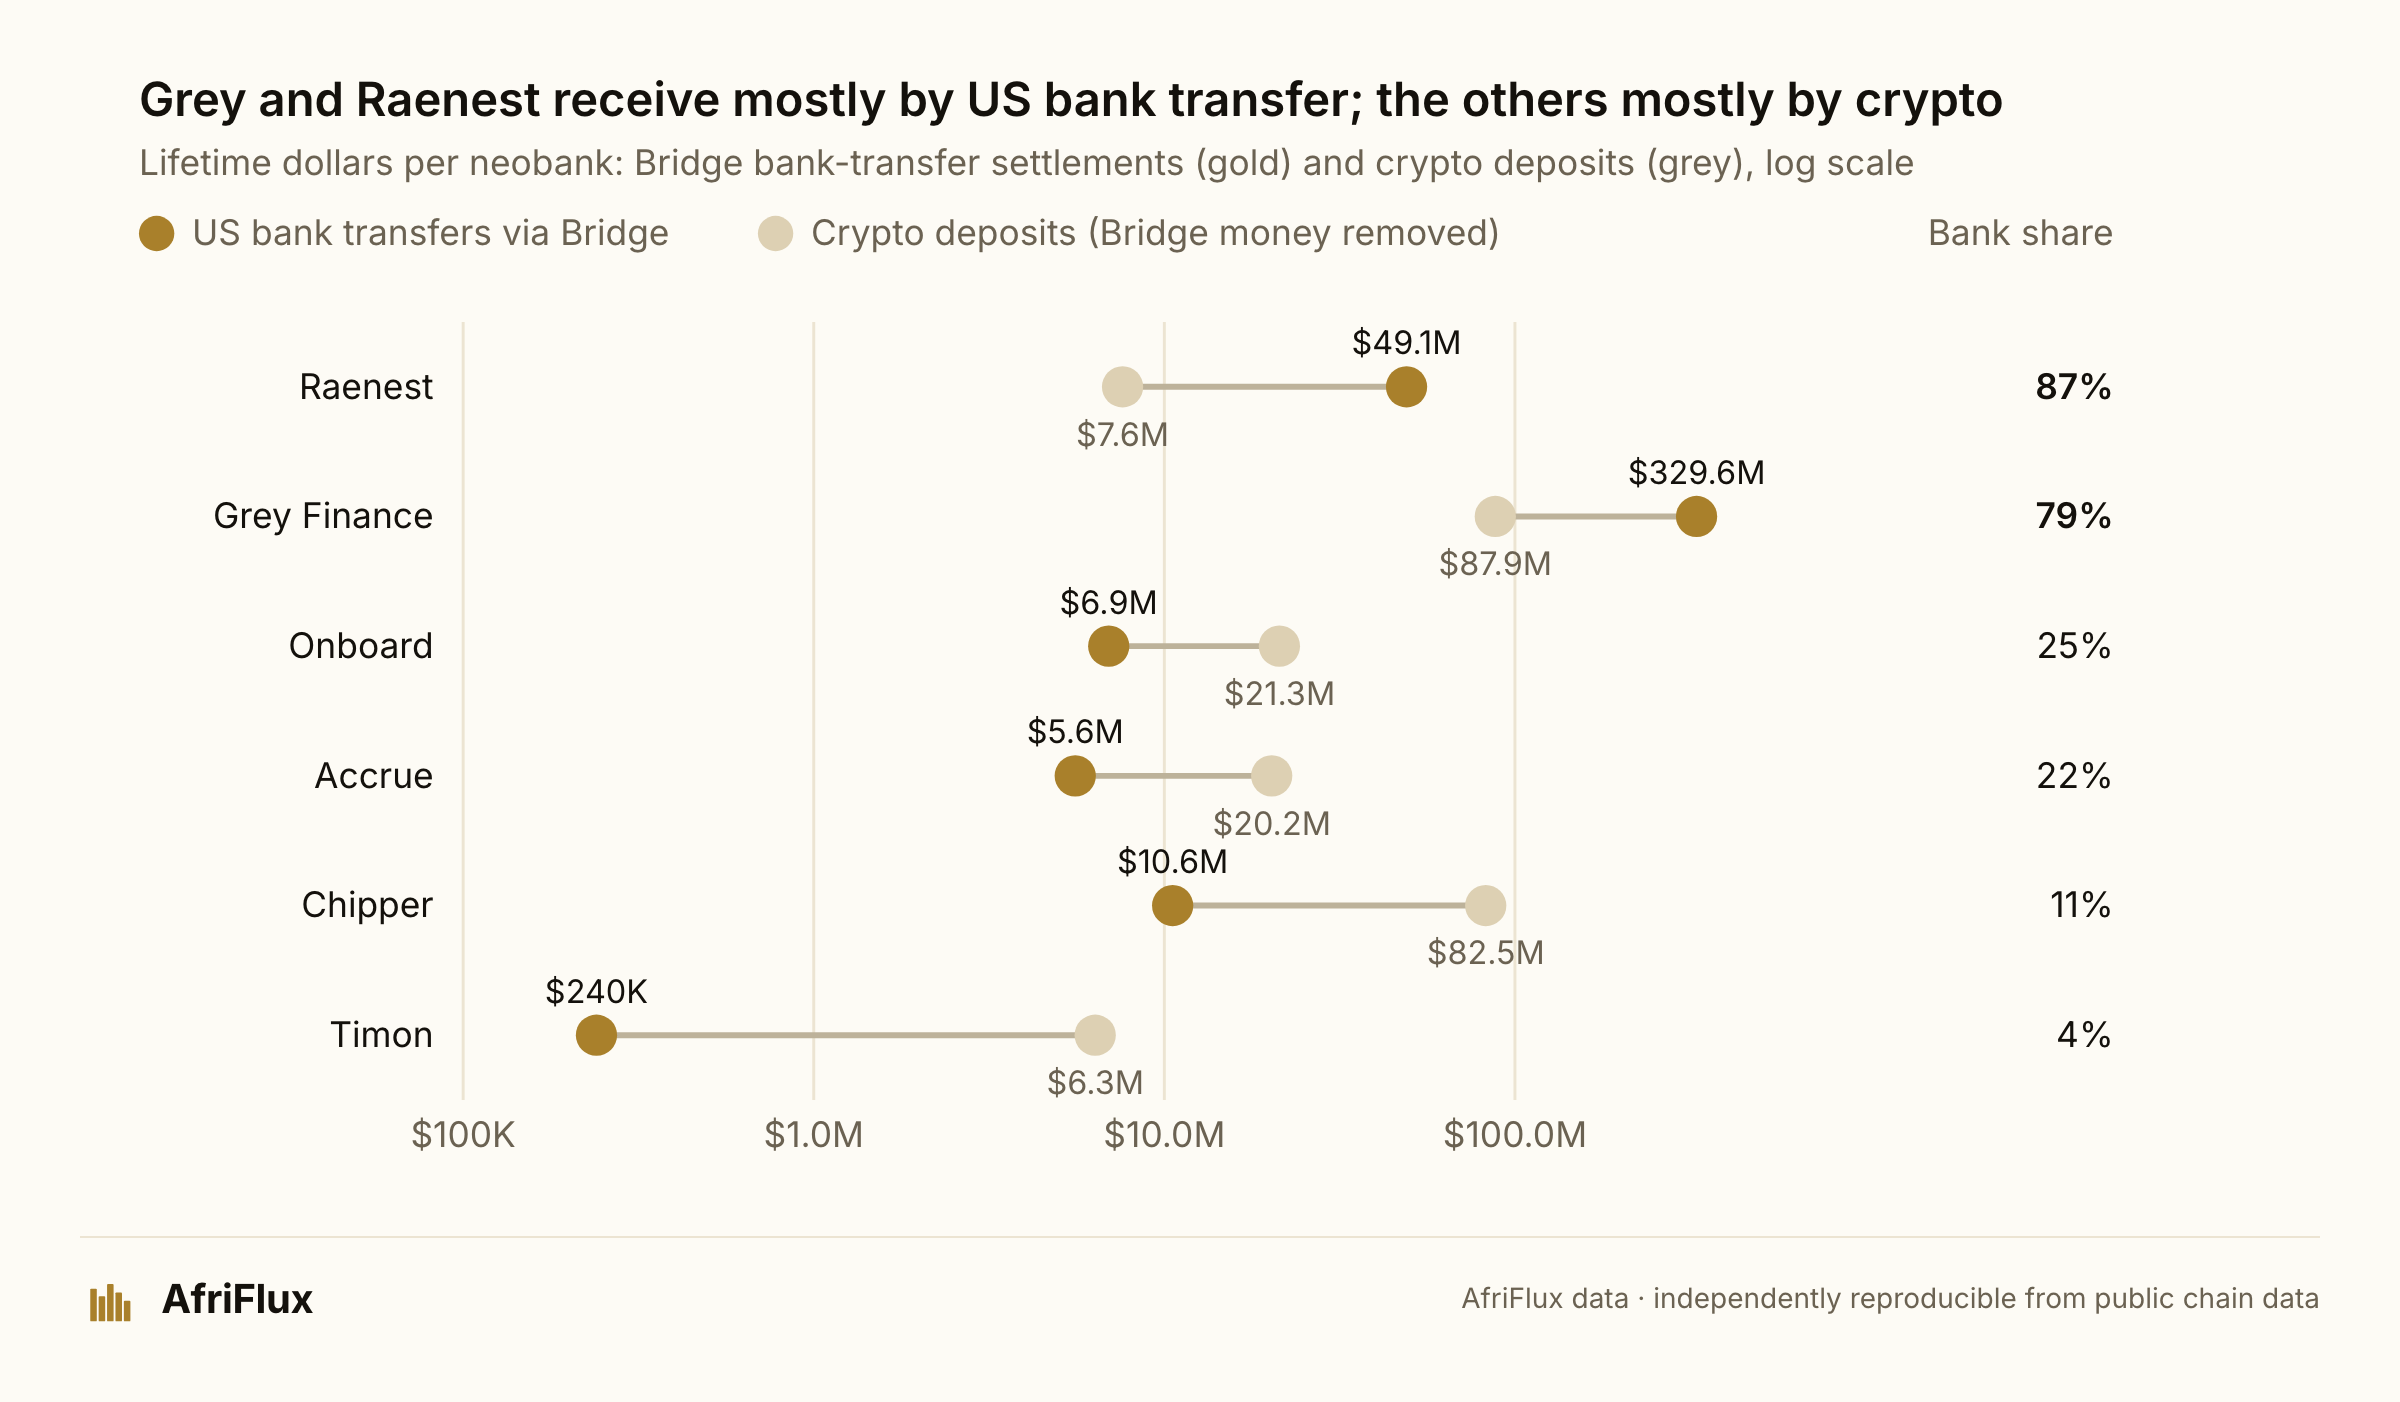
Grey and Raenest are bank-led: 79% and 87% of their dollars arrive as US bank transfers, and Raenest was at 92% in Q3 2026. The other four are crypto-led apps with a dollar account on the side, at 4–25%: Onboard 25%, Accrue 22%, Chipper 11%, Timon 4%. Onboard's share has been falling as its crypto deposits surged (+344.6% in Q3 2026). Two adjustments keep the sides apart: Onboard's and Chipper's Bridge money also lands on addresses we count as crypto deposits, so $6.83M and $2.20M are removed from their crypto figures (Grey's, Raenest's and Accrue's overlaps are under $0.4M each). The bank side counts Bridge only, so these shares are floors.
The neobanks also grow in different ways.
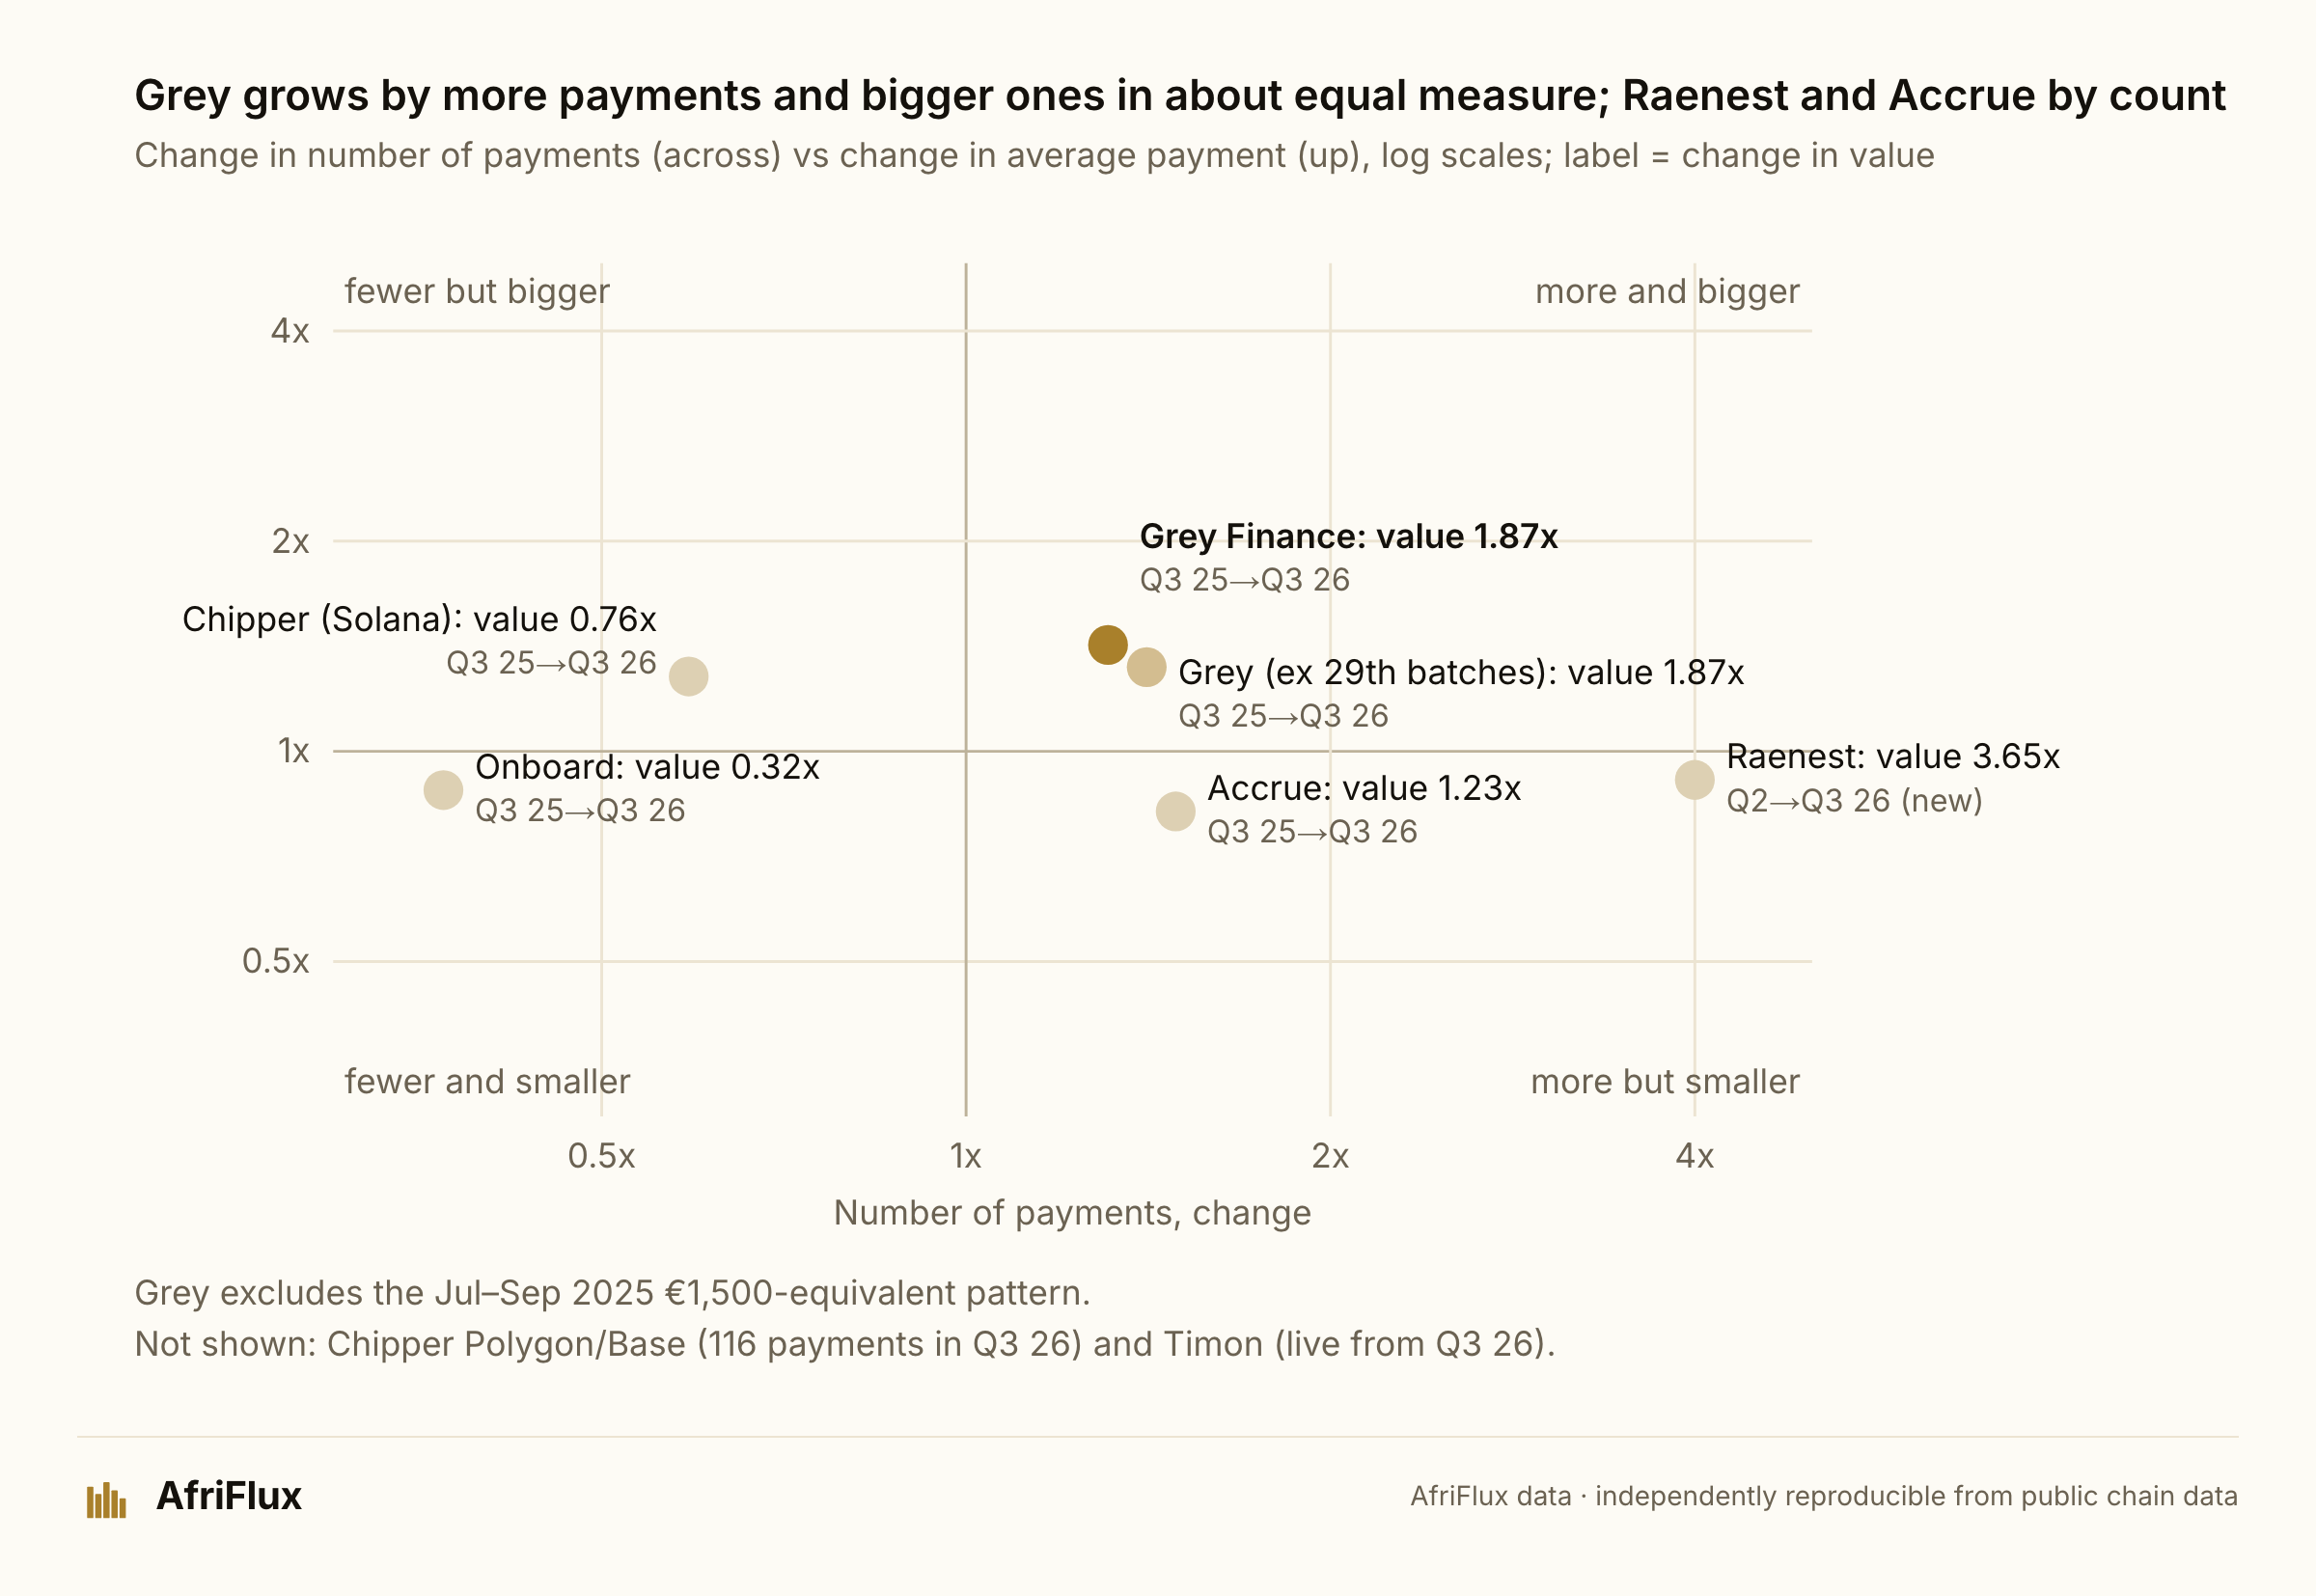
At Grey, growth is roughly half more payments and half bigger ones. From Q3 2025 to Q3 2026 its value grew 1.87x: payments 1.31x, average payment 1.42x ($288 to $410; median $76 to $100). How the split reads depends on the monthly 29th batch, which adds many small payments: with it, 43% of the growth is more payments; without it, 55%. Either way, the larger average comes from mix, not from the same payments getting bigger: more of Grey's payments now fall in the $1,000-plus bands (9.8% against 6.2% a year earlier), which accounts for $105 of the $122 rise in the average. Quarter on quarter, Grey's Q3 2026 was 8% below Q2.
| Neobank | Window | Value | Payments | Average payment | Median | What drives it |
|---|---|---|---|---|---|---|
| Grey Finance | Q3 2025 → Q3 2026 | 1.87x | 1.31x | $288 → $410 | $76 → $100 | about half each; bigger average from mix |
| Raenest | Q2 → Q3 2026 (new) | 3.65x | 4.00x | $381 → $348 | $165 → $135 | more payments (still onboarding) |
| Accrue | Q3 2025 → Q3 2026 | 1.23x | 1.49x | $866 → $712 | $210 → $300 | more payments; average fell |
| Onboard | Q3 2025 → Q3 2026 | 0.32x | 0.37x | $900 → $795 | $311 → $401 | shrinking, by fewer payments |
| Chipper (Solana) | Q3 2025 → Q3 2026 | 0.76x | 0.59x | $296 → $380 | $67 → $100 | shrinking, by fewer payments |
| Chipper (Polygon and Base) | Q3 2025 → Q3 2026 | 9.84x | 0.05x | $16 → $3,450 | $14 → $25 | a few large payments replaced thousands of tiny ones |
Chipper's total looks flat only because a handful of large Polygon and Base payments offset a 24% fall on Solana. Onboard is shrinking on this rail by fewer payments, consistent with its users moving to crypto deposits. Raenest's figures cover two quarters and describe onboarding, not mature growth. All figures exclude the €1,500-equivalent pattern.
Takeaway: Grey and Raenest are predominantly bank-led; the other observed neobanks have much larger crypto-deposit components, and each grows in its own way.
Where the dollars go next: the first hop
We cannot follow an earner's dollars after they land: on per-user rails the neobank sweeps each deposit address into its own wallet, so the timing of a "withdrawal" is the company's sweep schedule, not the user's choice. What we can follow is the wallet Bridge pays into, because for Grey and Raenest it holds almost nothing else: Grey's is 95% Bridge-funded, Raenest's 100%.
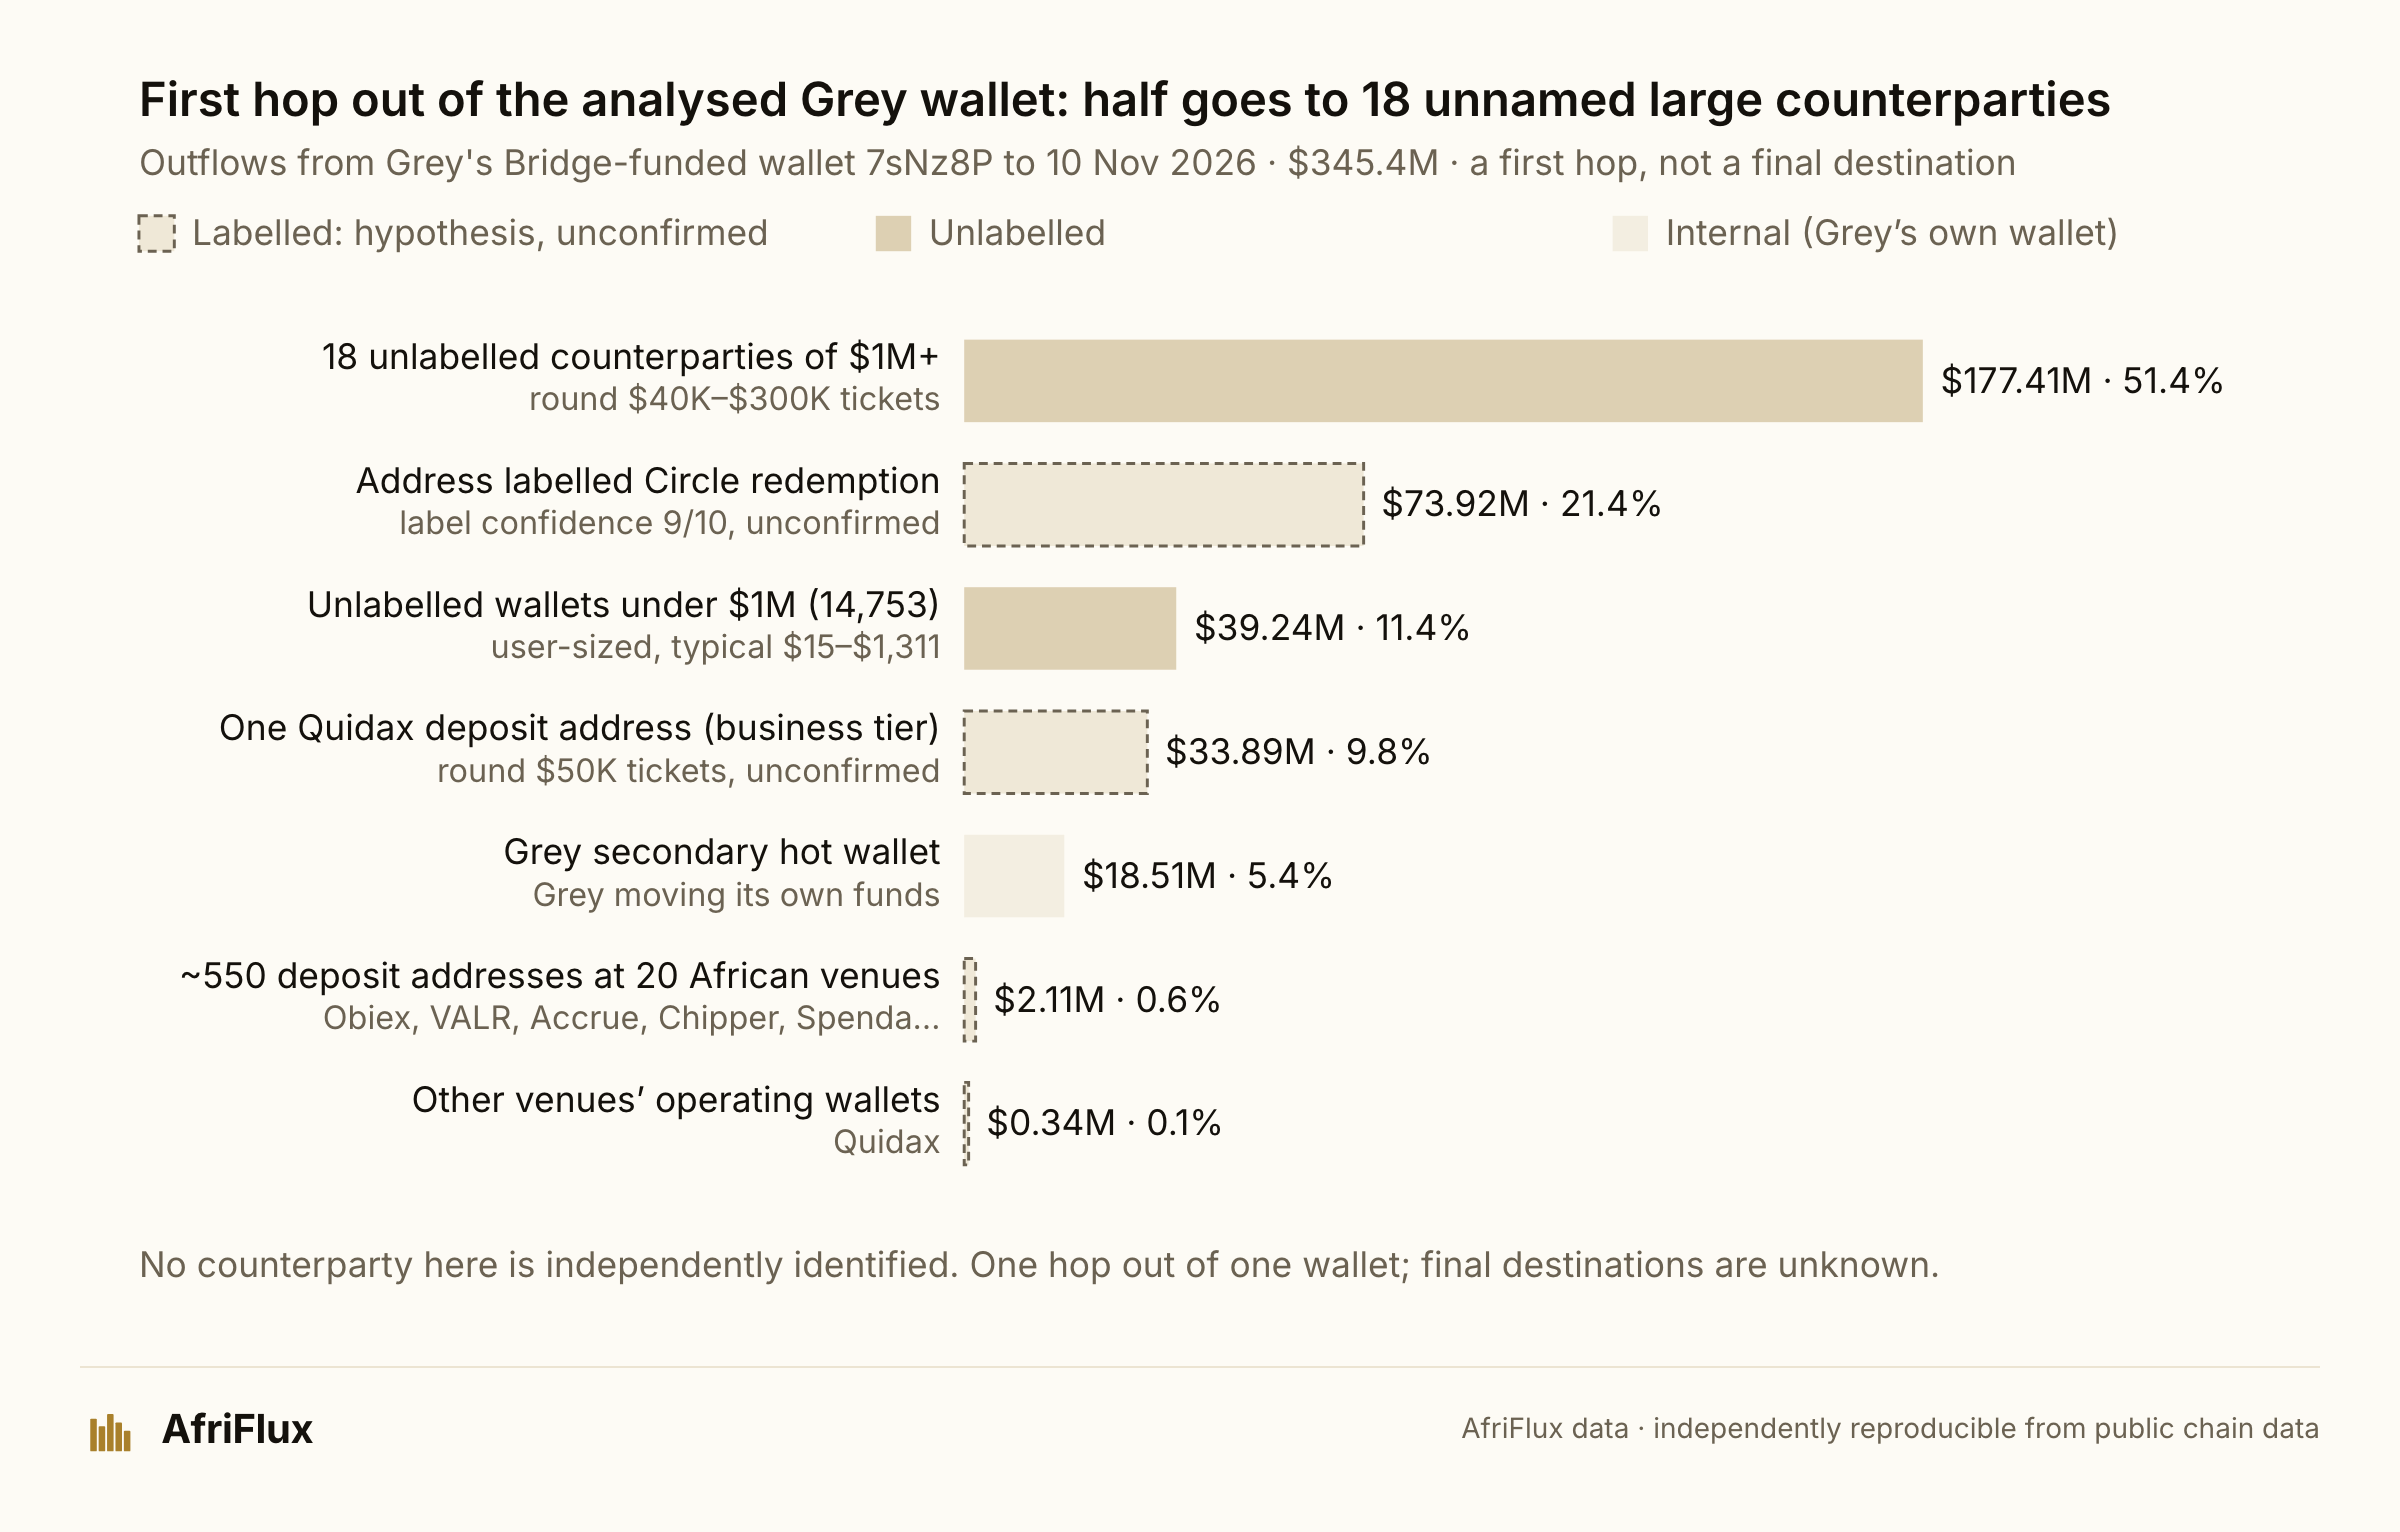
In the first hop out of the analysed Grey wallet, 51.4% goes to 18 unlabelled counterparties in round, treasury-sized tickets: the shape of bulk settlement rather than user withdrawals, though we cannot see what those counterparties are. A further 21.4% goes to an address our tables label as Circle redemption (confidence 9 of 10, inferred from another neobank's mapping, not independently confirmed), which would mean USDC redeemed for US dollars; 9.8% goes to a single Quidax deposit address classed as a business account; and 5.4% moves to Grey's own secondary wallet, an internal hop. About $2.1M (0.6%) goes to roughly 550 deposit addresses at 20 other African venues, Grey users moving dollars on to Obiex, VALR, Accrue, Chipper and others. The remaining 11.4% goes to 14,753 unlabelled wallets in user-sized amounts. None of this is a final destination: it is one hop out of one wallet, and it describes that wallet, not where all of Grey's customers' dollars end up.
Raenest, Chipper and Accrue route internally first (Raenest 99.6% to its settlement wallet, Chipper 100% to its master hot wallet, Accrue 75.5% to an exchange deposit address it controls), so their exits are a hop further and are not yet traced. This section stays open: the 18 large unlabelled destinations are unnamed, and the two labels shown are hypotheses until confirmed.
Takeaway: the first hop out of Grey's wallet shows treasury-sized transfers; where the money finally ends up is unresolved.
Conclusion
The dollars arriving in these neobanks' virtual accounts keep American banking hours. About three-quarters land in the windows after the Fed's ACH settlements, weekends carry 0.2%, and US bank holidays cut the flow by 99%, while Nigerian public and religious holidays and the naira leave it roughly unchanged. The pattern holds at every bank-fed rail, and it survives removing Grey, the €1,500-equivalent pattern and the 29th batches.
What the money is, we can only read from its shape. Most payments are small, but almost two-thirds of the value sits in payments of $1,000 or more, often in round amounts. Where earners can be followed, income recurs but rarely as a fixed salary, and most addresses go quiet within six months. Two recurring patterns, one euro-denominated and one a monthly batch of small payouts, show how a handful of payers can move a neobank's monthly total.
The neobanks use the rail differently. Grey and Raenest are bank-led; the other four are crypto-led apps with a dollar account on the side. And the limits are the ones set out at the top: this is the Bridge-attributed share of six neobanks' flow, a floor, read from amounts and times, never from who paid or why.
Get the next investigation in your inbox. The Sweep is our Monday newsletter: one attributed onchain number a week, with the method attached. Subscribe →
Methodology & limits
Data. 1,063,155 USDC and USDT transfers worth $402.02M from Bridge-controlled addresses to addresses AfriFlux attributes to six neobanks (Grey Finance, Raenest, Chipper, Onboard, Accrue, Timon), 7 October 2023 to 10 November 2026, on Solana, Ethereum, Base, Optimism, Polygon and Arbitrum. The dataset is frozen at block times before 11 November 2026 00:00 Eastern; every number and chart in the piece is drawn from that one file. USDC and USDT are valued at $1 (USDC is 99.5% of value). Bridge's own addresses are excluded. Times are block times converted to US Eastern; dates are Eastern calendar dates. This is the flow across the six neobanks in AfriFlux's coverage on this rail, not a census of the whole market.
Definitions.
- Payment: one settlement transfer from Bridge to a neobank address.
- Pooled vs per-user: Grey, Raenest, Accrue and Timon receive mostly into one company wallet; Onboard and most of Chipper into a deposit address per user. Earner-level findings use only addresses labelled as user deposit addresses.
- ACH window: 8:30–10:30am, 1:00–2:00pm and 5:00–7:00pm Eastern, the hours after the Federal Reserve's ACH settlements.
- Holiday comparison: US holidays against the same weekday a week either side; Nigerian public and religious holidays against the median of up to four same-weekday days within three weeks that are not US holidays, batch days or month edges, counting payments of $50+.
- Salaried: paid in 3+ months, in at least 75% of the months between first and last payment, at most two payments a month, monthly amount varying by under 20% (coefficient of variation of monthly totals, sample standard deviation; with the population standard deviation the count rises to 13 at Onboard and 14 at Chipper). Regular: the same without the stable-amount test.
- Retention: share of a first-month cohort that receives at least once at or after month 3, 6 or 12, counting only cohorts old enough to reach that month.
- Day-of-month index: average payments (or value) on a calendar day of the month divided by the average per day, with days that had no payments counted as zero.
- Fee fingerprint: the gap between a payment and the next multiple of $5 above it, kept when it repeats across many gross amounts.
Exclusions and adjustments. The €1,500-equivalent pattern (Grey, $1,700–$1,800, 1 July–30 September 2025) is excluded from trend, payday and growth measures and shown separately. Chipper is excluded from timing measures because it is not mainly fed by US bank transfers.
Does it hold without Grey? Grey is 82% of the value, so every headline was re-run without it, and without the €1,500-equivalent pattern and Grey's monthly 29th batches. The timing and calendar findings hold in every cut; without Grey the share landing in ACH windows rises to 84.9%. The median is the one fragile figure, moving between $50 and $150 depending on which flows are included.
| Scenario | Payments | Value | Median | Value in $1K+ payments | In ACH windows | Weekend | US holidays, count / value |
|---|---|---|---|---|---|---|---|
| All six neobanks | 1,063,155 | $402.0M | $84 | 63.9% | 74.1% | 0.21% | −99.2% / −96.9% |
| Without Grey | 256,643 | $72.4M | $50 | 53.8% | 84.9% | 0.44% | −98.5% / −97.6% |
| Without the €1,500-equivalent pattern and 29th batches | 901,064 | $360.9M | $106 | 60.3% | 77.5% | 0.25% | −99.0% / −96.4% |
| Without Grey and Chipper's Polygon/Base rail | 167,255 | $69.2M | $150 | 54.5% | 84.9% | 0.44% | −98.5% / −97.6% |
Concentration is moderate: the top 1% of payments carry 21.7% of value, the ten busiest of 1,079 days carry 6.5%, and the 20 largest of 4,751 per-user addresses hold 18.5% of per-user value. Timing columns exclude Chipper's Polygon and Base rail but keep its Solana flow, which lands 68.8% in the windows, so the all-six figure is 74.1%. The 74.3% quoted elsewhere in the piece excludes Chipper entirely (950,555 payments). The two differ only in that denominator.
Independent reproduction. A second analyst, working only from the frozen file and without sight of these results, re-derived the headline figures: totals, payment sizes, ACH-window shares, the busiest minutes, weekend and US-holiday effects, roundness, the day-of-month index, the €1,500-equivalent pattern, the 29th batch, Grey's growth split, earner classes and retention. All matched; four small differences were found and corrected before publication.
What this cannot show.
- Who pays, or why. Patterns are read as "payroll-like" or "a platform payout"; they are inferences, never identities.
- The whole market. These are the six neobanks AfriFlux tracks on this rail and only the Bridge-attributed part of their flow; other banking partners are not counted, so every bank-rail figure is a floor.
- What the neobanks charge. Their fees, if any, are taken off chain after the money lands.
- Individual users on pooled rails, and true retention where a neobank rotates deposit addresses.
- Exits beyond the first hop, and naira behaviour at the parallel-market rate, which we do not hold.
Corrections made during the analysis. First-pass holiday comparisons included batch days, month edges and Juneteenth in the baseline and showed swings of −74% and +128%; they were re-run on clean comparison days. An early earner filter counted two company wallets as users; earner results were re-run on user deposit addresses only, with no change of verdict. The €1,500-equivalent pattern and Grey's monthly 29th batch were identified and separated before trend and payday results were read.
Methodology questions, answered.
- What is the unit of analysis? One settlement transfer from a Bridge address to a neobank address. People appear only on per-user deposit addresses, which carry 2.4% of the value; there they are addresses, not verified customers.
- How are senders and receivers attributed? Senders are addresses in AfriFlux's curated list of Bridge-controlled addresses. Receivers come from three sources: neobank operating wallets, user deposit addresses discovered from each neobank's sweep pattern, and a curated list of Bridge settlement and collector addresses per neobank. Bridge's own addresses are removed from the receiver side.
- Are failed transfers, reversals, duplicates, internal transfers or fee splits excluded? Only successful onchain transfers are recorded. Duplicates: none (each chain, transaction hash and log index appears once). Reversals to Bridge: 2 transfers worth $30.50, kept. No transaction pays the same neobank twice, so fee splits do not appear as extra legs. Transfers between a neobank's own wallets are not counted.
- How are USD values set? USDC and USDT at $1. USDC is 99.5% of value; USDT is 0.5%, almost all of it Chipper's 79,006 small transfers ($1.93M).
- Are the neobanks observed over the same window? No. Chipper from Oct 2023 (37 months), Accrue Feb 2024 (33), Grey Jan 2025 (22), Onboard Apr 2025 (19), Raenest Nov 2025 (12), Timon Aug 2026 (2.5), all to 10 Nov 2026. Lifetime totals are not normalised for this; growth comparisons use matching quarters and flag Raenest's short history.
- Could one payout create several legs? Not within a transaction. One economic payment split across several transactions cannot be ruled out.
- How are company wallets told apart from user deposit addresses? By how they were mapped: operating, settlement and collector wallets are named in the mapping; user deposit addresses are those swept into a company wallet.
- What about address rotation and migrations? A neobank that issues a new deposit address to an existing user makes that user look new, so earner retention is a floor on address continuity. None of the headline findings depends on one address's continuity except the pooled wallets, which are stable across the period.
- How confident are counterparty labels? Every outflow label in the first-hop section comes from AfriFlux's own tables and none is independently confirmed; the strongest, "Circle redemption", carries a confidence of 9 of 10 from another neobank's mapping.
- Which findings survive excluding the largest venue, pattern or counterparty? The timing and calendar findings survive every cut tested. The median and the growth split are sensitive and are reported with their ranges.