More deposits, fewer wallets, smaller tickets — three weeks running
The market set a deposit record while active wallets fell and the average deposit dropped to $122. Deposits per wallet are at their highest this quarter. The same people are transacting more often in smaller amounts, which is what a payment habit looks like and not what a trading market looks like.
- 168,908
- Deposits
- 53,865
- Active wallets
- $122
- Average deposit
- +8.5%
- Deposits, four weeks
a record
down 2.3%
from $146 four weeks ago
on 0.7% fewer wallets
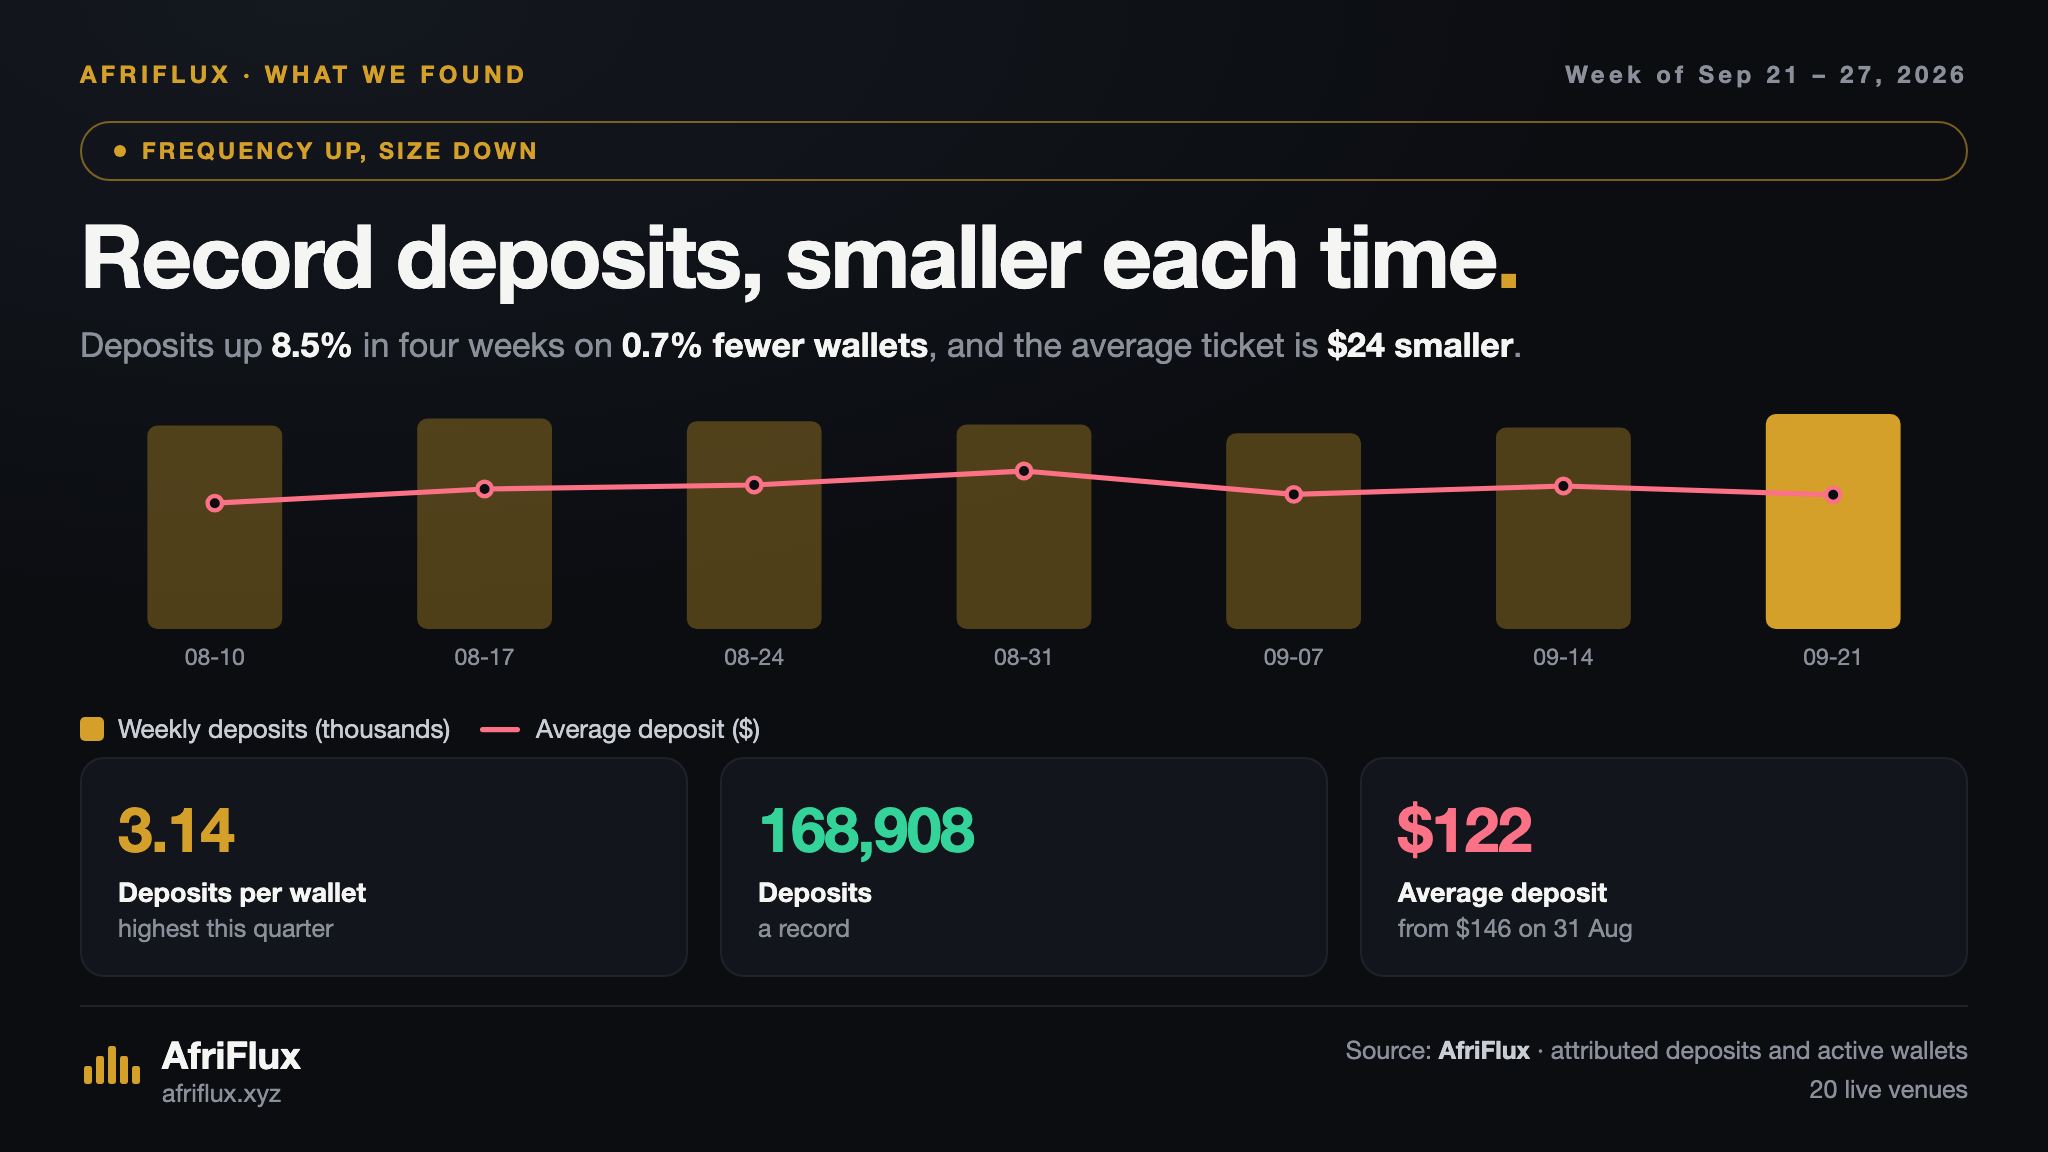
The market set a deposit record this week. It did so while its wallet count fell and its average ticket shrank.
| Week | Deposits | Wallets | Average | Per wallet |
|---|---|---|---|---|
| 31 Aug | 160,568 | 54,233 | $146 | 2.96 |
| 7 Sep | 153,774 | 54,007 | $122 | 2.85 |
| 14 Sep | 158,188 | 55,156 | $131 | 2.87 |
| 21 Sep | 168,908 | 53,865 | $122 | 3.14 |
Across four weeks, deposits are up 8.5% on 0.7% fewer wallets, and the average deposit is $24 smaller.
The claim
This market is being used more like a payment rail and less like a trading venue, and the shift is visible in the shape of the numbers rather than in the headline.
A trading market grows by ticket size: the same people move more money per transaction when they are taking positions. A payment rail grows by frequency: the same people transact more often, in amounts set by what they are actually paying for.
For three weeks the frequency has risen and the size has fallen. Spenda, at $33 a deposit and 46% of all deposits in the market, is the clearest single case, but it is not the only one — Monica set its own deposit record this week at 37,433, and its average is $122.
Where this could be wrong
Two honest objections.
The mean is a weak statistic here. A few very large tickets moving in or out of a week can shift the average without anything changing for ordinary users. We do not publish a median deposit across the market, and until we do, the average is doing more work in this argument than it should.
Composition, not behaviour. The mix of venues is changing — Jeroid entered the index this week, Daya Pro's large tickets swing the average on their own — so some of this could be which venues are growing rather than how people are using them. The wallet-level series would settle it; the venue-level series cannot.
What survives both objections is the raw count: 168,908 deposits from 53,865 wallets is the highest ratio of activity to participants we have recorded, and that ratio does not depend on the average at all.
Method
Weekly attributed deposit counts, distinct active depositing addresses and mean deposit size across the 20 live venues in the AfriFlux index, for the ISO weeks from 10 August to 27 September 2026. Deposit-side only. Deposits per wallet is the ratio of the two counts within a week; a wallet is not a person, and one person may hold several. The average is the mean, which a handful of large tickets can move, so the deposit count and wallet count are the load-bearing figures here rather than the average alone.
How attribution works →Cite this
Free to cite with attribution. No embargo, no approval needed.
AfriFlux (2026). More deposits, fewer wallets, smaller tickets — three weeks running. Published 28 September 2026. https://www.afriflux.xyz/feed/more-deposits-smaller-tickets
Reproducing a chart? Use this line: Source: AfriFlux — on-chain intelligence for Africa's stablecoin economy. afriflux.xyz